3 ETFs That Could Move in October
October's set to be a busy month, with plenty of potential market-moving events on the docket. While high-level U.S.-China trade talks are set to resume tomorrow, Oct. 10, third-quarter earnings season is poised to kick off next week when big banks -- including JPMorgan Chase (JPM) and Goldman Sachs (GS) -- step up to the plate. What's more, the next two-day Fed meeting in the U.S. is scheduled to start on Tuesday, Oct. 29, and the Brexit deadline is slated for Thursday, Oct. 31.
One exchange-traded fund (ETF) that could be impacted by tariff negotiations is the iShares China Large-Cap ETF (FXI), which tracks the performance of big-cap Chinese stocks that trade on the Hong Kong Stock Exchange. The fund hit an annual high near $46 in April, before plunging to a two-year low of $37.66 by mid-August.
A rally off here was quickly halted in mid-September by FXI's 120-day and 200-day moving averages, which sent the shares tumbling below $40 by the start of October. Today, the shares are testing this round-number mark amid upbeat U.S.-China trade headlines, last seen 1.5% higher at $40.30.
FXI options traders are betting on bigger gains in the near term. While the October 42 call has seen the biggest increase in open interest over the last 10 days, with nearly 106,000 contracts added, the November 42 call is most active today. Buy-to-open activity has been detected at each short-term strike, meaning speculators are targeting a breakout above $42 over the next five weeks.

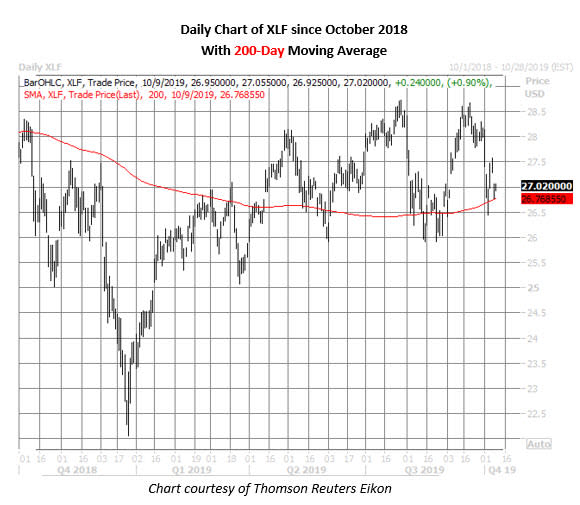
Meanwhile, both earnings season and a Fed meeting could create volatility for the Financial Select Sector SPDR Fund (XLF) over the next several weeks. The ETF jumped 0.4% on Sept. 18 -- the day of the Fed's September rate cut -- before embarking on a two-day losing streak. The shares have since strung together three straight weekly losses, and are down another 1.6% since last Friday's close to test support at their 200-day moving average, last seen at $27.02.
Short-term XLF options traders have rarely been as put-skewed as they are now, per the fund's Schaeffer's put/call open interest ratio (SOIR) of 3.37, which ranks in the 99th annual percentile. The October 25 and 27 puts are home to peak front-month open interest, and data suggests the two strikes may have been used in early September to initiate a long put spread. If this is the case, the spread strategist expects XLF to settle right at $25 at the close next Friday, Oct. 18.
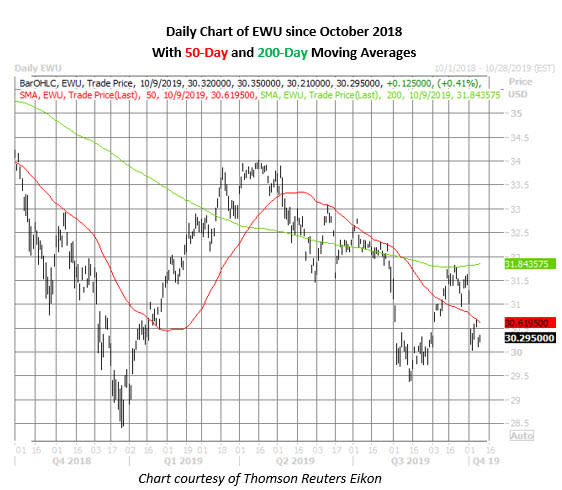
Finally, the iShares MSCI United Kingdom ETF (EWU) will likely be in focus ahead of the Oct. 31 deadline for Britain to exit the European Union (EU) with or without a deal. Earlier today, U.K. Prime Minister Boris Johnson requested a rare Saturday sitting for Parliament to discuss possible Brexit options ahead of next week's EU summit.
Looking at the charts, EWU has been stuck chopping below its 200-day moving average since breaching it during a late-July bear gap. The shares were rejected at this trendline in late September following a rally off their mid-August seven-month low of $29.38, which sent the fund tumbling below its 50-day moving average earlier this month. Today, EWU is up 0.3% at $30.29.
EWU's SOIR of 0.29 ranks in the 4th percentile of its 12-month range, pointing to an unusual call-skew among short-term traders. Not all of this activity is of the traditional bullish variety, though, with sell-to-open activity detected at the October 33 and 34 calls -- the fund's top two front-month open interest positions.