3 Stock Charts for Thursday: Apple, Merck and Verizon
Ouch. That was … painful. On Wednesday, the S&P 500 lost a stunning 3.29%, ending the day at its lowest close since July and booking the biggest single-day loss since February.
Advanced Micro Devices (NASDAQ:AMD) arguably dished out the most overall damage, losing 8.2% of its value as traders continue to doubt how well-deserved the recent rally was. Roku (NASDAQ:ROKU) was the most notable loser, however, off 12.5% as investors began believing it was anything but immune to marketwide weakness.
The drubbing for the day makes it tough to determine which stocks are worth a closer look as Thursday’s action begins. Almost all stocks are in steep downtrends now, but almost all stocks are well oversold and ripe for a dead-cat bounce. There are some discernible technical developments with the stock charts of Apple (NASDAQ:AAPL), Verizon Communications (NYSE:VZ) and Merck & Co. (NYSE:MRK), however. Here’s a closer look at each, and what may happen next.
InvestorPlace - Stock Market News, Stock Advice & Trading Tips
Apple (AAPL)

It’s difficult to bet against the world’s biggest and most profitable company, particularly when its stock appears impervious to market weakness. But Apple shares raised a red flag on Wednesday and are now just one misstep away from a really ugly prospect.
And regardless of how well the company is doing, if another key floor snaps, AAPL shares have a long way to fall.
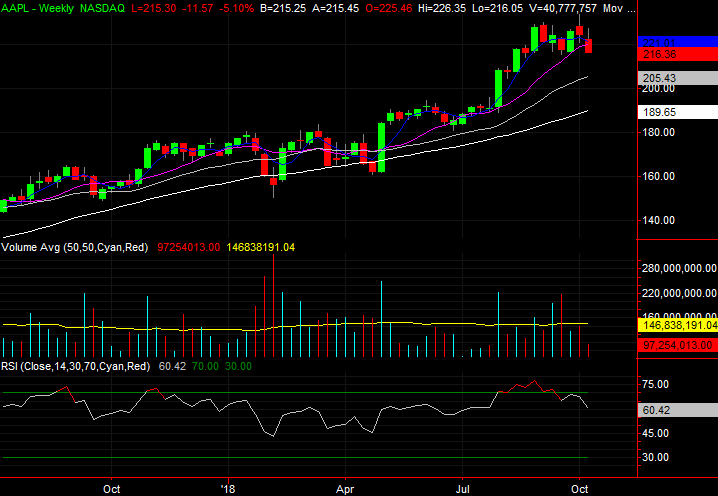
• The red flag is yesterday’s break below the blue 20-day moving average line and the purple 50-day moving average. Both were the ultimate cause of the August rally, but they’re not holding the stock up now.
• The make-or-break line in the sand is roughly $216.30, near where Apple made Wednesday’s low, and last month’s low. If it breaks, there’s nothing left nearby to stop the bleeding.
• The weekly chart indicates just how unusual and overzealous the buying has been since May. Assuming Apple shares revert to their long-term mean, a move back to the 200-day moving average near $189 is on the table.
Verizon Communications (VZ)
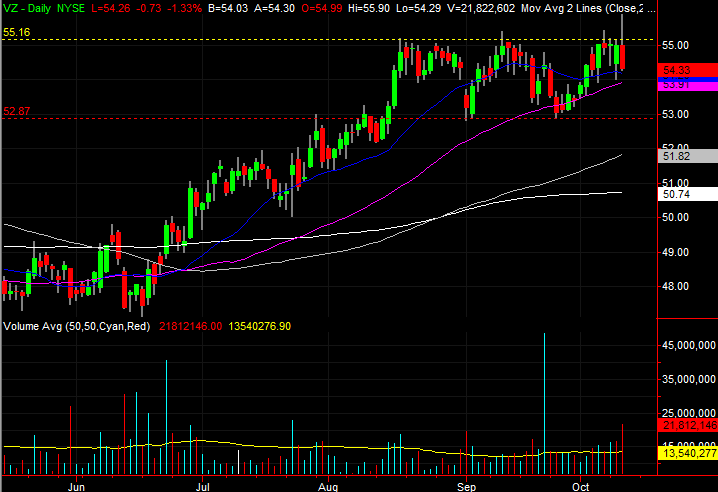
For the early part of Wednesday’s session, Verizon Communications shares went into breakout mode, pushing above an important resistance level that has been in place since August. By the end of the day, though, VZ shares were not only back inside that range, but pointed in a bearish direction.
That doesn’t mean much of anything right now, good or bad. But, it’s noteworthy nonetheless, because sooner or later Verizon is going to break out of this rut for good. The question is, in which direction?
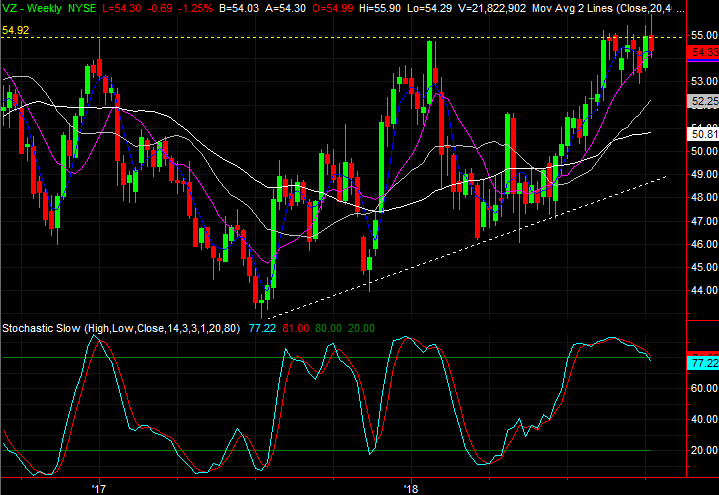
• The trading range is between $55.16 and $52.87, plotted with dashed lines on the daily chart. The push above the upper boundary on Wednesday didn’t last, though that may have had more to do with the market than with Verizon.
• Notice that even with the selloff, the 20-day and 50-day moving average lines are holding up as support levels.
• Though uncertainty is still plentiful, the potential for a bullish move here isn’t insignificant. The resistance near $55 has been in place since early last year, but the bulls continue to test it. Sooner or later — if the environment doesn’t get in the way — that ceiling could be broken for good, setting the stage for a prolonged rally.
Merck & Co. (MRK)
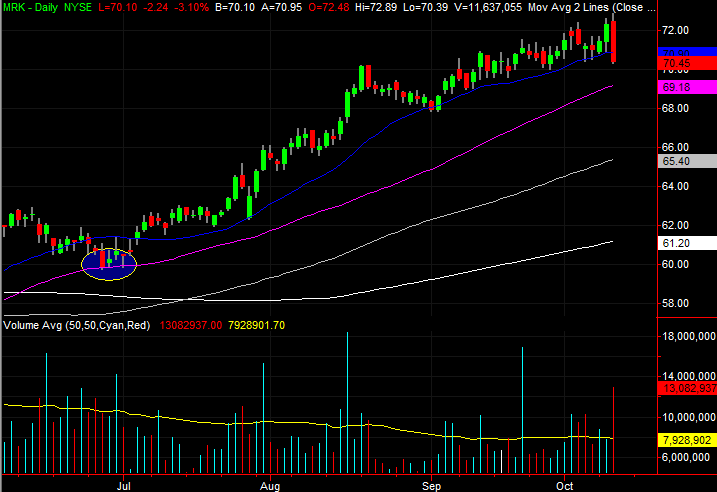
Finally, Merck & Co. has been one of the market’s curious outliers of late, shrugging off marketwide weakness with some help at a key moving average line. That persistent strength may have also left MRK uncomfortably open to profit-taking though, and Wednesday’s tumble appears to have opened the door.
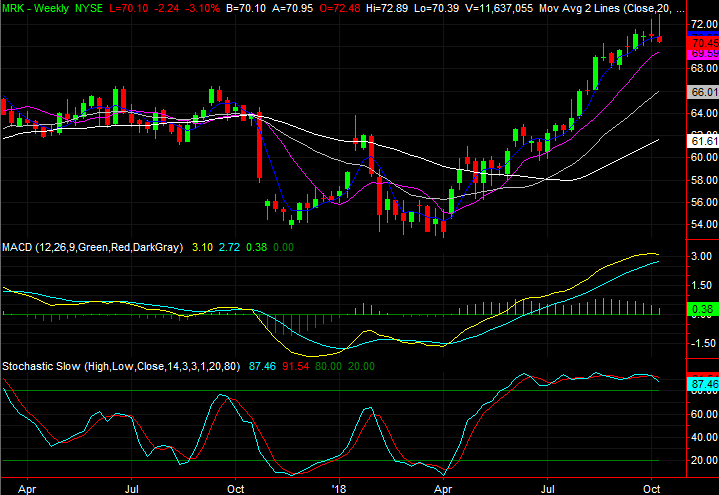
• The support line in question is the 20-day moving average line, plotted in blue on the daily chart. Yesterday’s close at $70.45 was the first close below that line in a long while.
• Just as telling is the shape and placement of Wednesday’s bar. With an open above Tuesday’s close and a close below Tuesday’s low, we have an almost-perfect “outside day” bar that often signals a pivot from an uptrend to a downtrend.
• The weekly chart puts things in perspective in terms of how far the stock might slide. If selling momentum is allowed to develop, a revisit of the 200-day moving average line at $61.20 isn’t out of the question.
As of this writing, James Brumley did not hold a position in any of the aforementioned securities. You can follow him on Twitter, at @jbrumley.
More From InvestorPlace
The post 3 Stock Charts for Thursday: Apple, Merck and Verizon appeared first on InvestorPlace.
