Some 360 Capital Group (ASX:TGP) Shareholders Are Down 34%

It's nice to see the 360 Capital Group Limited (ASX:TGP) share price up 17% in a week. But if you look at the last five years the returns have not been good. In fact, the share price is down 34%, which falls well short of the return you could get by buying an index fund.
See our latest analysis for 360 Capital Group
In his essay The Superinvestors of Graham-and-Doddsville Warren Buffett described how share prices do not always rationally reflect the value of a business. One flawed but reasonable way to assess how sentiment around a company has changed is to compare the earnings per share (EPS) with the share price.
360 Capital Group became profitable within the last five years. That would generally be considered a positive, so we are surprised to see the share price is down. Other metrics might give us a better handle on how its value is changing over time.
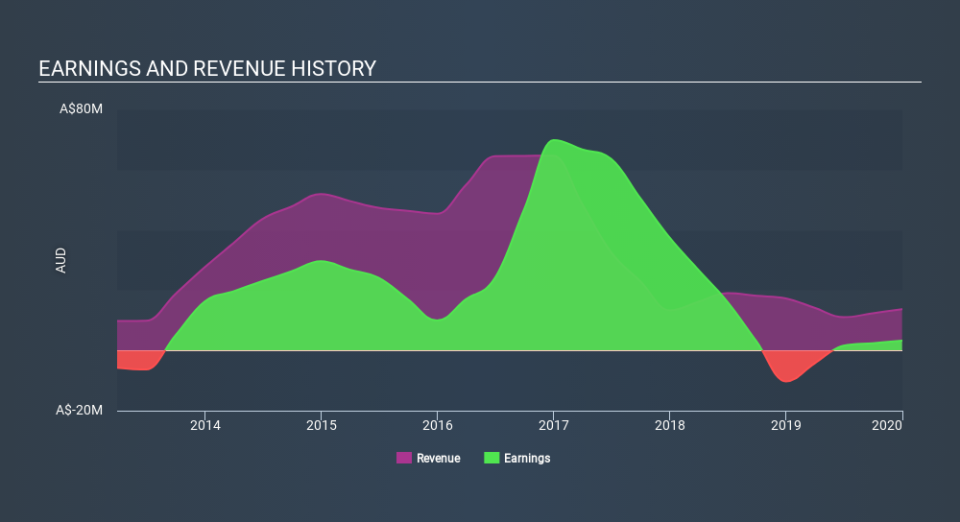
The most recent dividend was actually lower than it was in the past, so that may have sent the share price lower. The revenue decline of about 31% per year might also encourage sellers.
The company's revenue and earnings (over time) are depicted in the image below (click to see the exact numbers).
Take a more thorough look at 360 Capital Group's financial health with this free report on its balance sheet.
What About Dividends?
As well as measuring the share price return, investors should also consider the total shareholder return (TSR). The TSR is a return calculation that accounts for the value of cash dividends (assuming that any dividend received was reinvested) and the calculated value of any discounted capital raisings and spin-offs. Arguably, the TSR gives a more comprehensive picture of the return generated by a stock. We note that for 360 Capital Group the TSR over the last 5 years was -13%, which is better than the share price return mentioned above. This is largely a result of its dividend payments!
A Different Perspective
While it's never nice to take a loss, 360 Capital Group shareholders can take comfort that , including dividends, their trailing twelve month loss of 9.1% wasn't as bad as the market loss of around 17%. Given the total loss of 2.8% per year over five years, it seems returns have deteriorated in the last twelve months. Whilst Baron Rothschild does tell the investor "buy when there's blood in the streets, even if the blood is your own", buyers would need to examine the data carefully to be comfortable that the business itself is sound. It's always interesting to track share price performance over the longer term. But to understand 360 Capital Group better, we need to consider many other factors. For instance, we've identified 5 warning signs for 360 Capital Group (1 can't be ignored) that you should be aware of.
If you would prefer to check out another company -- one with potentially superior financials -- then do not miss this free list of companies that have proven they can grow earnings.
Please note, the market returns quoted in this article reflect the market weighted average returns of stocks that currently trade on AU exchanges.
If you spot an error that warrants correction, please contact the editor at editorial-team@simplywallst.com. This article by Simply Wall St is general in nature. It does not constitute a recommendation to buy or sell any stock, and does not take account of your objectives, or your financial situation. Simply Wall St has no position in the stocks mentioned.
We aim to bring you long-term focused research analysis driven by fundamental data. Note that our analysis may not factor in the latest price-sensitive company announcements or qualitative material. Thank you for reading.
