These 4 Measures Indicate That BHP Group (ASX:BHP) Is Using Debt Safely
David Iben put it well when he said, 'Volatility is not a risk we care about. What we care about is avoiding the permanent loss of capital.' So it might be obvious that you need to consider debt, when you think about how risky any given stock is, because too much debt can sink a company. We can see that BHP Group Limited (ASX:BHP) does use debt in its business. But is this debt a concern to shareholders?
When Is Debt A Problem?
Debt assists a business until the business has trouble paying it off, either with new capital or with free cash flow. Part and parcel of capitalism is the process of 'creative destruction' where failed businesses are mercilessly liquidated by their bankers. However, a more usual (but still expensive) situation is where a company must dilute shareholders at a cheap share price simply to get debt under control. Of course, plenty of companies use debt to fund growth, without any negative consequences. When we think about a company's use of debt, we first look at cash and debt together.
Check out our latest analysis for BHP Group
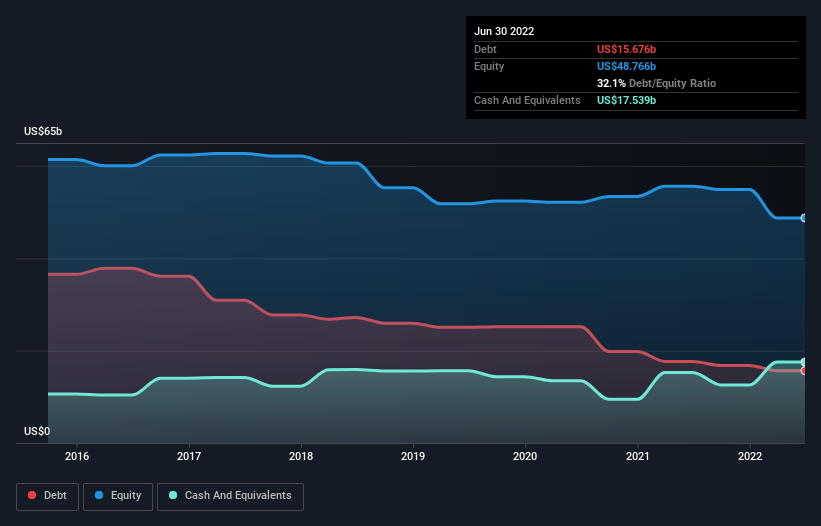
How Much Debt Does BHP Group Carry?
As you can see below, BHP Group had US$15.7b of debt at June 2022, down from US$17.7b a year prior. However, it does have US$17.5b in cash offsetting this, leading to net cash of US$1.86b.
How Healthy Is BHP Group's Balance Sheet?
We can see from the most recent balance sheet that BHP Group had liabilities of US$16.9b falling due within a year, and liabilities of US$29.5b due beyond that. On the other hand, it had cash of US$17.5b and US$5.69b worth of receivables due within a year. So its liabilities outweigh the sum of its cash and (near-term) receivables by US$23.2b.
Of course, BHP Group has a titanic market capitalization of US$128.3b, so these liabilities are probably manageable. But there are sufficient liabilities that we would certainly recommend shareholders continue to monitor the balance sheet, going forward. While it does have liabilities worth noting, BHP Group also has more cash than debt, so we're pretty confident it can manage its debt safely.
Also good is that BHP Group grew its EBIT at 14% over the last year, further increasing its ability to manage debt. There's no doubt that we learn most about debt from the balance sheet. But ultimately the future profitability of the business will decide if BHP Group can strengthen its balance sheet over time. So if you're focused on the future you can check out this free report showing analyst profit forecasts.
But our final consideration is also important, because a company cannot pay debt with paper profits; it needs cold hard cash. BHP Group may have net cash on the balance sheet, but it is still interesting to look at how well the business converts its earnings before interest and tax (EBIT) to free cash flow, because that will influence both its need for, and its capacity to manage debt. During the last three years, BHP Group produced sturdy free cash flow equating to 76% of its EBIT, about what we'd expect. This cold hard cash means it can reduce its debt when it wants to.
Summing Up
While BHP Group does have more liabilities than liquid assets, it also has net cash of US$1.86b. And it impressed us with free cash flow of US$26b, being 76% of its EBIT. So we don't think BHP Group's use of debt is risky. When analysing debt levels, the balance sheet is the obvious place to start. But ultimately, every company can contain risks that exist outside of the balance sheet. For instance, we've identified 2 warning signs for BHP Group (1 is a bit concerning) you should be aware of.
At the end of the day, it's often better to focus on companies that are free from net debt. You can access our special list of such companies (all with a track record of profit growth). It's free.
Have feedback on this article? Concerned about the content? Get in touch with us directly. Alternatively, email editorial-team (at) simplywallst.com.
This article by Simply Wall St is general in nature. We provide commentary based on historical data and analyst forecasts only using an unbiased methodology and our articles are not intended to be financial advice. It does not constitute a recommendation to buy or sell any stock, and does not take account of your objectives, or your financial situation. We aim to bring you long-term focused analysis driven by fundamental data. Note that our analysis may not factor in the latest price-sensitive company announcements or qualitative material. Simply Wall St has no position in any stocks mentioned.
Join A Paid User Research Session
You’ll receive a US$30 Amazon Gift card for 1 hour of your time while helping us build better investing tools for the individual investors like yourself. Sign up here
