5 Charts That Will Give Investors the Big Picture for Ford Stock
It hasn’t been easy for General Motors (NYSE:GM), Fiat Chrysler (NYSE:FCAU) Daimler (OTCMKTS:DDAIF) or even Ferrari (NYSE:RACE). But most of all, it’s been a tough road for Ford Motor (NYSE:F). F stock is down a whopping 24% so far this year and more than 20% since early June.
Ouch. Now yielding 6.4%, many investors are wondering if Ford is a screaming buy. Combined with a low valuation (although not the lowest in the group), there’s a reason investors are starting to look at Ford. But what do the charts say?
We pulled several charts for F stock, including the one, two, three, five and 10-year. With those, we should get a decent idea on what the technical outlook is for Ford. Let’s start from the beginning.
InvestorPlace - Stock Market News, Stock Advice & Trading Tips
F Stock One-Year Chart
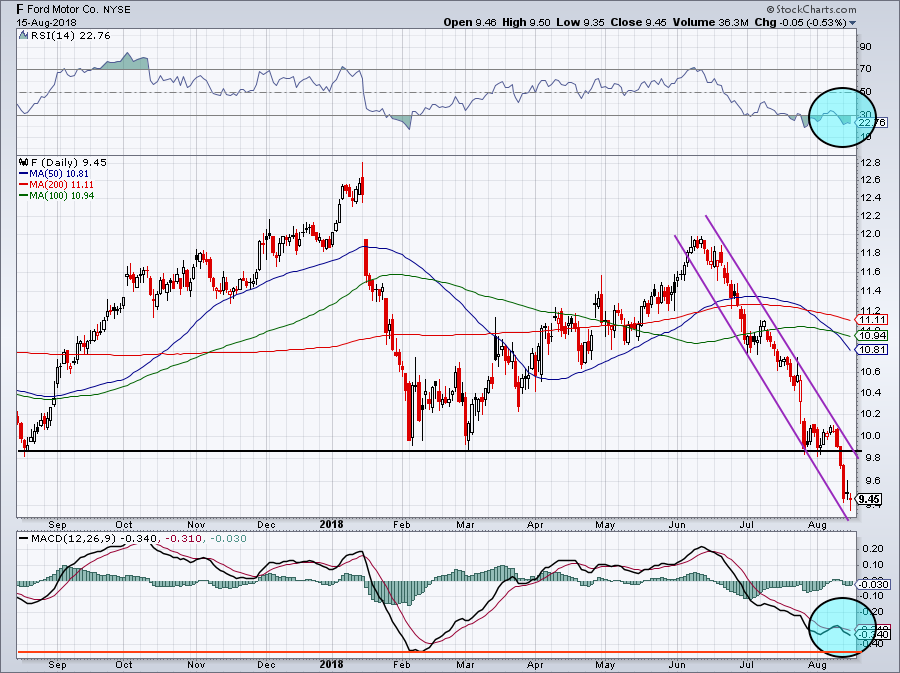
Shares may be getting a bit exhausted to the downside. As you can see, F stock has fallen from ~$12 to less than $9.50 in only two months. That’s a serious beat down, even if the fundamental story isn’t all that great.
Ford is stuck in the midst of a stagnant U.S. auto market. Average selling prices are strong, but there just isn’t any growth. That’s why shares trade at just 7 times this year’s earnings.
Wednesday’s candle shows Ford closed well off the lows, despite strong selling pressure in the overall market. Maybe its yield is getting too attractive or perhaps investors feel the fall is overdone. It could be both. Let’s see if shares can rebound and get back over this $9.80 to $10 area.
If it can, F stock may have bottomed.
F Stock Two-Year Chart
Like the one-year chart, the two-year shows how critical of a level $9.80 to $10 is for Ford. Below it and it’s hard to be really bullish at this point, no matter how oversold shares are.
The yield is big and worries over global trade wars have put a real negative overhang on the industry. As you can see with the blue circles, the oversold nature of the stock is confirmed by the RSI. However, that’s not a reason to buy on its own. After all, F stock was flashing an oversold condition at $10.60, so it can always go further than investors may first think.
It would be much more bullish to see F stock breakout of its downward channel (purple range) and get back above $10. A retest and failure of $10 would be quite bearish though.
F Stock Three-Year Chart
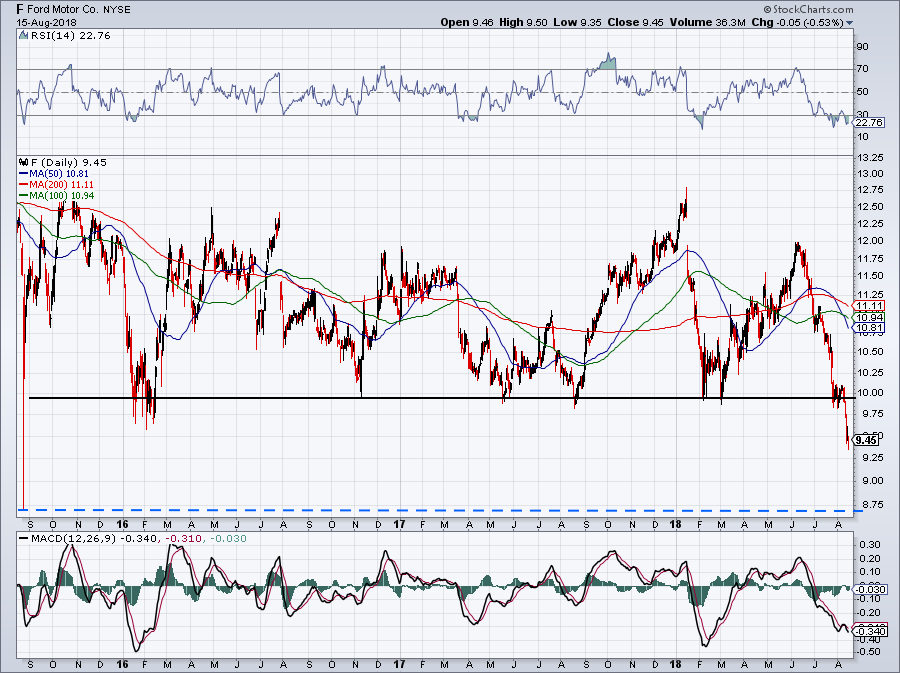
Given that F stock is below key support, finding the next level is important. Now below its 2016 lows, Ford stock is at risk of falling to $8.75, its 2015 flash-crash low.
Does it deserve that? No, but that doesn’t mean it won’t get there. Especially if there’s a broad-market decline. If it does, that would put Ford’s dividend yield near 6.85%.
F Stock Five-Year Chart
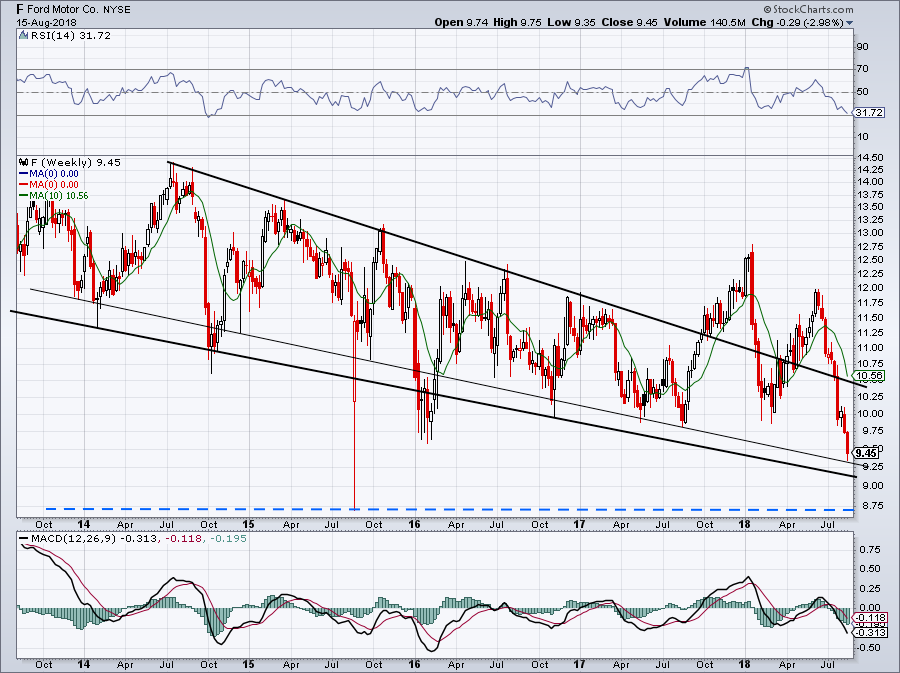
There could be some reprieve in the five-year chart.
On the weekly chart above, we can start to see some long-term channels forming and one that shows F stock may have some support in the $9 to $9.25 region. For investors who are snooping for a bottom in Ford, this is likely where I’d start.
You can see $8.75 is again highlighted on the chart. Should Ford break below its channel, that’s likely where it’s going.
F Stock Ten-Year Chart

Similar to the five-year chart, the 10-year chart highlights the downward channel that Ford stock is currently in.
However, it also shows that the $9 to $9.50 area is a big one from 2012 to 2013. I would love to see this level firm up and act as support, as channel support and level support come together.
Further, the weekly RSI levels are highlighted on the top of the chart. F stock now sports its lowest RSI since late-2014. In each instance of these highlights, Ford went on to post a sharp bounce. But remember, this is a weekly chart, so these moves could take time to play out. Additionally, more downside can still exist before the bounce.
Overall, F stock could be nearing a bottom, but we don’t want to blindly catch the falling knife. Keep these levels handy so you know what to watch for in the coming days, weeks and months.
Bret Kenwell is the manager and author of Future Blue Chips and is on Twitter @BretKenwell. As of this writing, Bret Kenwell was long GM.
More From InvestorPlace
The post 5 Charts That Will Give Investors the Big Picture for Ford Stock appeared first on InvestorPlace.
