8 Top Dividend Stocks for 2019
Whether you're looking for a source of income for today or building your nest egg for the future, owning dividend stocks can serve as a valuable part of your long-term investing portfolio. But not all dividend stocks are created equal, and it's important to own companies with the cash flow and balance sheet strength to support that dividend payout over the long term.
Dividend stocks pay off for investors of all kinds. Getting a steady check from a company you've invested in makes it much easier to ride out the ups and downs of the stock market, whether you're living off that dividend payout or reinvesting the proceeds to grow your portfolio.

There's no such thing as a money tree, but dividend stocks are pretty close. Image source: Getty Images.
Here are eight top dividend stocks that look perfect for 2019 and beyond, listed alphabetically:
Company | Dividend yield | Market capitalization |
|---|---|---|
AT&T (NYSE: T) | 7% | $207.4 billion |
Brookfield Infrastructure Partners L.P. (NYSE: BIP) | 5.5% | $9.4 billion |
CareTrust REIT (NASDAQ: CTRE) | 4.3% | $1.6 billion |
Ford Motor Company (NYSE: F) | 7.7% | $31.0 billion |
General Motors Company (NYSE: GM) | 4.5% | $47.9 billion |
ONEOK (NYSE: OKE) | 6.1% | $21.8 billion |
TerraForm Power (NASDAQ: TERP) | 6.9% | $2.3 billion |
Verizon Communications (NYSE: VZ) | 4.3% | $228.4 billion |
Dividend yield and market capitalization as of December 28, 2018.
The table above also shows the dividend yield, which is the percentage of the current stock price the company is expected to pay in dividends based on its most recent payout, as well as the market capitalization -- or market cap -- which is the total value of all its shares.
What is a dividend stock?
A dividend stock is a company that pays a dividend -- generally a cash payment but sometimes shares of stock -- on a regular schedule (usually quarterly, but sometimes monthly or even semi-annually or annually) and has a historical track record of growing its dividend as well as a plan to pay one in the future.
Dividend stocks are often older, more mature companies that generate far more cash flows than management can efficiently reinvest back into the business for a strong rate of return. However, that's not always the case; many companies with higher rates of growth and solid prospects to continue growing may also pay a dividend if their cash flows exceed the needs of the business or if their business structure requires it, as is often seen in real estate.
There are also certain industries that lend themselves to paying dividends, such as certain sectors of the energy, utility, and telecommunications industries, which generate substantial and relatively predictable cash flows. People with a penchant for stocks that pay dividends are often referred to as "income investors," as they receive regular income from the dividends paid by their stocks.
There's much more to picking dividend stocks than just finding some familiar names and buying the ones with the highest yields. Understanding these key terms can help you make the best dividend stock choices for your portfolio.
Business structures optimized for paying dividends
Two corporate structures lend themselves to paying out dividends.
Real estate investment trusts. Called REITs for short, these investments are actually required to pay out at least 90% of their GAAP (generally accepted accounting practices) earnings in dividends in exchange for a special tax status that significantly reduces income tax expense. An REIT is, as the name describes, focused on real estate. Some of the specifics include requirements that at least 75% of its assets be real estate, cash, or U.S. federal government bonds, and 75% of its gross income must be derived from real estate.
In general, there are two types of REITs. The most common and often the simplest to understand is an "equity REIT," which owns and manages property. Equity REITs specialize in a certain kind of property, such as shopping malls, office buildings, healthcare property, self-storage facilities, or others, but some REITs may own a mix of property types.
The other kind of REIT is a "mortgage REIT," which is more like a lender than a property owner. Mortgage REITs derive income by investing in mortgage-backed securities, which are bundles of real estate loans written by lenders and banks. They often use substantial amounts of debt to buy the securities they invest in, profiting from interest earned on the mortgages they buy. The difference is called the spread.
The problem with this model is that mortgage REITs often refinance their debt at higher rates, while the majority of the mortgage debt on the market will remain fixed at the current low rates. This could result in a big squeeze in profits for much of this industry in the years ahead, making it harder to find long-term winners. For this reason, most investors should avoid mortgage REITs.
Master limited partnerships. MLPs, according to the Securities and Exchange Commission, must own and operate assets that are "focused on exploration, development, mining, processing, or transportation of minerals or natural resources." This can include oil and gas, coal, timber, and other resources.
The corporate structure -- the limited partnership part -- means these entities don't pay corporate income tax. Also called "pass-through" entities, they pass along the tax burden to their investors, along with additional complexity in the form of a schedule K-1 form, come tax season. The upshot is that the structure generally makes MLPs solid income investments, with the downside being more complex -- and sometimes higher -- taxes.
Some MLP investments can even cause investors to end up owing tax on investments held inside a retirement account. This can occur if you get more than $1,000 in total unrelated taxable business income, or UBTI, from all of your MLP investments in your retirement accounts in a single year. Some MLPs -- such as Brookfield Infrastructure Partners, one of the dividend stocks included in this article -- have intentionally structured their businesses to avoid generating UBTI. But if you're investing inside a retirement account like a 401(k), traditional IRA, or Roth IRA, it's up to you to understand whether this is a risk for a particular MLP before you buy.
The best way to find out if a specific MLP pays income that is classified as UBTI is to visit its investor relations website and find the "tax information" section, which should describe this, or to contact investor relations directly if you can't find anything on the website.
Want to know whether a stock is an REIT or MLP before you buy? MLPs often have the word "partner" or the initials "L.P." in the name, while REITs will sometimes, but not always, include the word "trust." The best way to make sure is by consulting the company's investor relations website, which is easy to find with a web search.
How do you evaluate a dividend stock?
The following important metrics can help you get a picture of how secure a particular company's dividend is.
Distribution. Basically the same as a dividend (in that you, the investor, get cash), this is the term used by master limited partnerships (MLPs) to describe their regular payout. This is because investors in pass-through entities like MLPs may share in the ordinary income, interest income, royalties received, capital gains, and a litany of other kinds of income the MLP may receive, which could even include ordinary dividends. This lump is called a distribution, because, well, it's more than just a dividend.
Distributions from an MLP can be taxed at different rates than the usual capital gains rate at which ordinary and qualified dividends are taxed. Consider what you'll net in taxes before selecting an MLP because of its yield; the income after tax could be lower than you expect.
Balance sheet. This is the financial statement that lists all of a company's assets, liabilities, and shareholder equity, or how much of the company is owned by people who bought its stock. You can find it in a company's annual report or filing to the Securities and Exchange Commission (SEC). In general, a company with a strong balance sheet has plenty of access to cash or capital, valuable assets that can generate cash flows, and a debt balance it can easily handle repaying no matter the state of the economy.
It's important to note that different companies in different industries can have very different balance sheets yet still be considered strong or weak. For instance, many of the companies featured here have very high debt loads, but their balance sheets are still considered strong. Telecoms, pipeline and other infrastructure operators, and REITs use a lot of debt to finance their asset acquisitions, but these assets also generate very steady, predictable cash flows, and often under long-term contracts with little impact from economic recession. Others, such as GM and Ford, also carry a lot of debt, but much of their debt is related to their auto lending operations (meaning their is a recoverable asset tied to that debt) while also carrying substantial cash balances to tap during down cycles in the auto industry. Make sure you do some research on how to best interpret the balance sheet you're looking at in the context of the company's sector.
Payout ratio. This is the percentage of a company's GAAP net income that it pays out to shareholders in dividends. In general, the lower the payout ratio, the safer it should be, since that means the company has a wider margin of safety before it would have to cut the payout. Furthermore, a payout ratio approaching or even above 100% might be a big red flag, since it means a company could be paying out even more money in dividends than it's actually bringing in as earnings.
This ratio generally measures the past four quarters -- referred to as trailing 12 months or TTM -- or the prior fiscal year, so it's a backward-looking metric. This is important for two reasons. First, since it's looking at the past, it's critical to know if something significant has changed that could affect a company's future earnings before assuming that the payouts are secure. Second, a high payout ratio one year doesn't mean the dividend payout is going to get cut; look at the long-term trends, and take the time to understand why the payout ratio increased before crossing a dividend stock off of your list.
For instance, sometimes a company may sell off assets at a loss or otherwise write down the value of assets on its books, generating a "paper loss" it must reflect in GAAP accounting. In this case, this nonrecurring -- and also noncash -- accounting action can artificially inflate the payout ratio, even if the dividend's long-term viability hasn't changed. An excellent recent example of this is GM -- featured in this article:
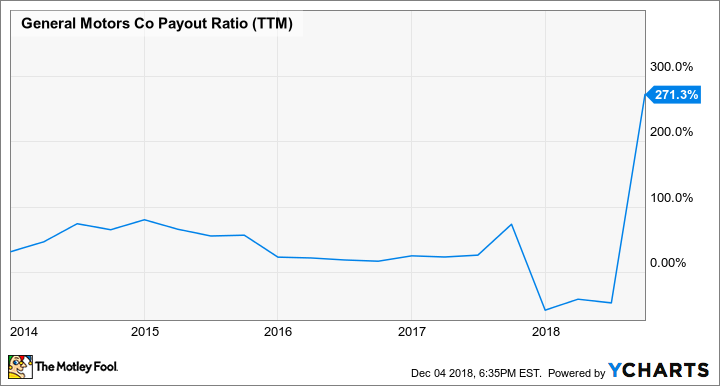
GM Payout Ratio (TTM) data by YCharts.
In short, GM is in the midst of some major restructuring, and that's resulting in a number of significant one-time expenses, the majority of which are noncash. And while these costs are taking a bite out of GM's GAAP results this year, they aren't likely to impact GM's ability to support its dividend.
This can also work the other way. If a company's payout ratio falls sharply from one year to the next, it's worth investigating to find out why, whether it's something that will recur or was only a one-time gain, and whether it's something that will boost the company's cash flows.
Cash payout ratio. Some companies issue a dividend payout in the form of stock, but the vast majority of dividends are paid out in cash. For this reason, the cash payout ratio can sometimes be a better metric or often a great metric to use along with the earnings payout ratio.
For instance, the payout ratio of AT&T -- another company we will discuss below -- was above 100% as recently as 2015 and consistently above 80% in recent years. But as a portion of cash flows, its payout ratio has actually been steadily between 60% and 75% the past few years.
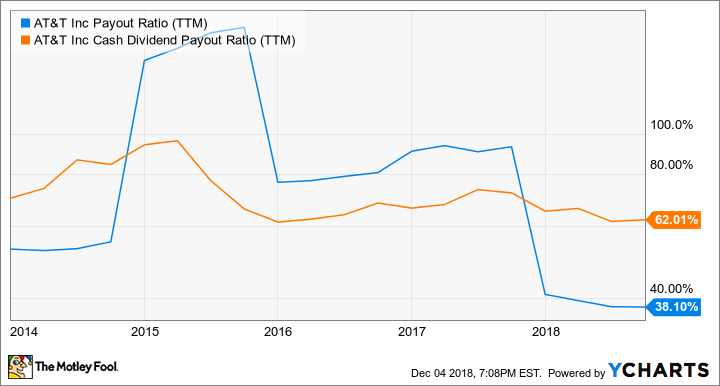
T Payout Ratio (TTM) data by YCharts.
Operating cash flows. This measures the cash flows a company's business operations generate, subtracting cash flows from investing activities such as capital expenditures on new equipment or property and cash flows from financing activities such as issuing debt or selling stock to raise cash, all found on its cash flow statement, another sheet found in the annual report and SEC filings.
Operating cash flow can be used to measure a company's core business's ability to generate recurring cash. However, since it excludes other real (often recurring) expenses, it's not a replacement for GAAP net income, or funds from operations for REITs or MLPs, but it can be a handy tool with which to evaluate a company's ability to support its dividend or distribution.
Free cash flow. This is operating cash flows minus capital expenditures, or money spent investing in the business. In essence, this is what a company has left over after everything else -- except the dividend -- has been paid. Like many of the other measures above, it can vary from one period to the next depending on where a company is in its investment cycle and where its industry is in its own economic cycle. But at the end of the day, a company must consistently generate more free cash flow than it pays out to shareholders for a dividend to be sustainable over the long term.
Funds from operations. Also called FFO, this metric is often considered the best proxy for earnings from REITs and many MLPs. This is because these businesses own a lot of real estate, which can generate substantial depreciation expense tied to an asset -- real estate -- that generally increases in value. FFO adds depreciation (decline in value of assets) related to these assets back in to net income while also adjusting out any gains or losses on asset sales. The result is a more accurate measure of a REIT's or MLP's earnings than the standard GAAP methods, and it is the best tool to use both to determine how sustainable its dividend is and to measure its value.
Distributable cash flow. Often used by master limited partnerships, this metric starts with net income, adds back in depreciation and amortization, and subtracts capital expenditures. The remainder is what the MLP has left over that it could technically distribute back to investors. This measure is often used both to value many MLPs and to determine how secure the distribution is.
What are the risks of dividend stocks?
In short, dividend stocks are still publicly traded stocks available to investors in the open market. Even the best-run companies can go through struggles, and many industries are affected by major economic cycles through no fault of their management. This can make their stock prices volatile in the short term, just like any other stock. Simply put, there is no guarantee that you can't or won't lose money in any one dividend stock, no matter how high quality the company or how long it's been paying a dividend.
To reduce your risk of permanent losses and improve your chances of getting superior returns and steady dividend payouts, the best strategy is to own a diverse basket of high-quality companies, with an emphasis on those with strong balance sheets and predictable, steady cash flows. Then hold them for the long term, ideally five years or more.
The market will rise and fall. But history tells us that over time, it goes up about twice as often as it falls, and that makes holding over the long term your best hedge against losses. Getting those regular dividend checks goes hand in hand with developing the patience and willingness to hold your dividend-paying investments through any market condition. It pays to be patient, literally!
Two top telecom dividend stocks
When it comes to delivering communications services like cell phone service, broadband internet, and entertainment content, scale matters. And when it comes to scale, Verizon Communications and AT&T have it in spades. Combined, these two companies own some 70% of the U.S. wireless market, while also having millions of business and residential telecommunications customers accessing data through their extensive fiber networks.
Between them, AT&T and Verizon have collected $195 billion in revenue over the past year and earned almost $66 billion.
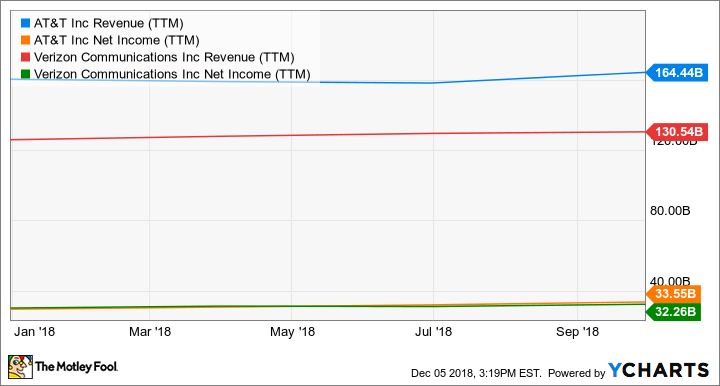
T Revenue (TTM) data by YCharts.
When it comes to using those massive cash flows to reward shareholders, both have extremely solid records as dividend stocks. AT&T and Verizon have been able to increase their payouts every year for more than a decade, and with earnings and cash payout ratios below 40% and around 62%, respectively, they also have pretty wide margins of safety with which to maintain the current payout.
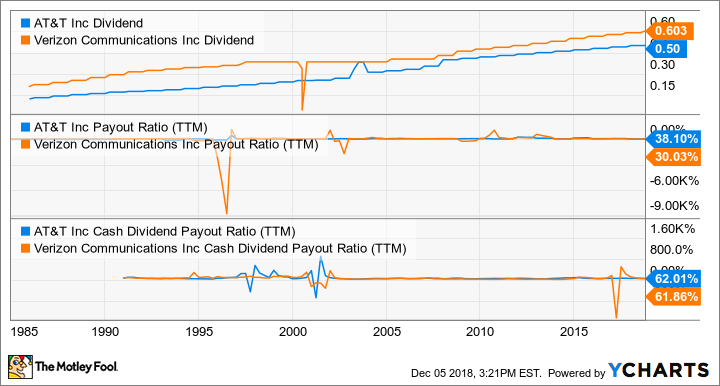
T Dividend data by YCharts.
But dividend investors shouldn't just look for continuity: At least enough growth to outpace inflation is warranted, and these two telecom giants have that covered, too. The upcoming rollout of 5G wireless technology should be a boost for both, but especially Verizon, while AT&T is betting big on its plans to move heavily into entertainment content following its acquisition of Time Warner in 2018.
Yet the market is pricing both at some of their lowest valuations in years.
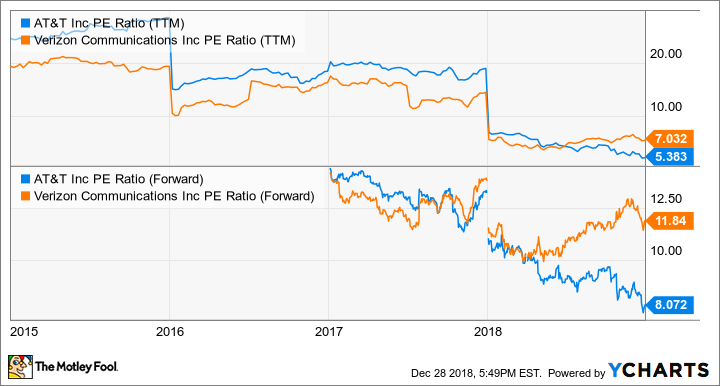
T PE Ratio (TTM) data by YCharts.
Both companies are cheap based on their historical earnings-based valuations -- that is, valuing a company's stock price based on its recent earnings. With their stocks selling for 7.0 times and 5.4 times the past year's earnings, the market is expecting almost no earnings growth in coming years. And while neither is likely to generate double-digit earnings growth over the long term, they're both built to deliver steady mid-single-digit increases that should deliver enough extra cash flows to pay for regular dividend bumps.
With 6.5% and 4.1% yields, respectively, at recent prices and very cheap valuations, AT&T and Verizon deserve a look from anyone looking for a dependable, relatively high yield with modest growth potential.
Two top automaker dividend stocks
Like AT&T and Verizon, Ford and General Motors are two of the oldest, biggest automakers out there. They also sport high dividend yields of 7.7% and 4.5%, respectively, and operate very capital-intensive businesses that require steady investments to maintain and improve.
But where the telecom business lends itself toward quite steady, regular cash flows, the auto industry is heavily cyclical, ebbing and flowing with changes in consumer demand. That's certainly what we have seen over the past year; both companies have reported relatively flat revenues as auto sales reached a cyclical peak in North America in 2016 and have been relatively flat the past two years.

F Revenue (TTM) data by YCharts.
And while this is completely normal, expected, and generally temporary, the auto industry is also in the early stages of what could be a huge, more permanent transformation. Autonomous vehicles, shared mobility, and a move away from combustion engines are all big, expensive initiatives that, along with consumer demand moving away from sedans, has these auto stalwarts spending billions of dollars to remain relevant. And that can -- as GM's payout ratio chart above showed -- cut into the available cash to pay a dividend. This is where cash -- having it -- is king.
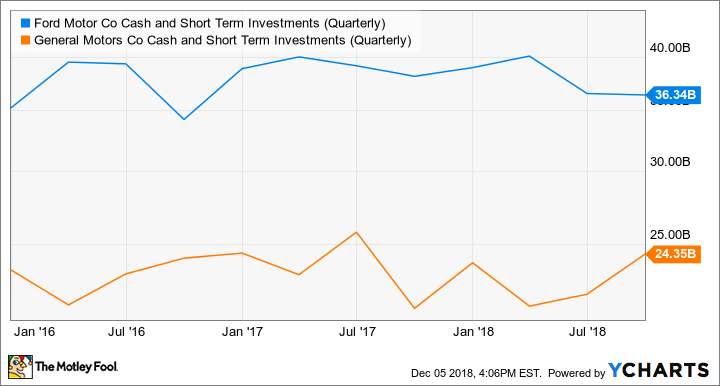
F Cash and Short-Term Investments (Quarterly) data by YCharts.
In short, both GM and Ford now maintain massive cash cushions to support their operations when auto sales go through cyclical weakness but also as a hedge against periods during which they must make big financial investments in R&D and manufacturing to make sure their products remain relevant.
Both Ford and GM trade for single-digit forward earnings estimates and have plenty of cash flow generation and balance sheet strength to ride out the auto industry's turmoil while also investing for the future. There's no telling what the auto business will do over the next year or two, but these two stalwarts are positioned to emerge as long-term winners, rewarding patient investors with a nice payout along the way.
Three top infrastructure and energy dividend stocks
When it comes to generating rock-solid cash flows and rewarding investors with dividends, companies that own and operate the assets moving and providing energy and other critical infrastructure can make for some of the very best. While these businesses uniformly carry heavy debt loads, making them susceptible to rising interest rates, they also own and operate assets that generate steady, predictable cash flows across every economic cycle. Three top picks are ONEOK, Brookfield Infrastructure Partners, and TerraForm Power.
In general, many of the assets these three companies operate are like toll roads, moving another company's product -- like oil or natural gas -- and collecting a fee for the service but not being tied to the actual price of oil or gas. Other services include providing water or telecommunications services, businesses that see very little change in demand during economic downturns, as these basic services are necessary for everyday life or are simply the minimum cost of doing business.
It gets even better. It's typical that an infrastructure company will contract its services, often at rates that escalate with inflation, and generally for very long terms. Add it all up, and these are ideal industries in which to find dividend stocks, offering substantial, predictable sources of regular cash flows that can be counted on for the long term.
One of the best, most reliable dividend stocks in the oil and gas business, ONEOK is a dividend growth dream. Not only does it pay an attractive 5.4% yield at recent prices, but with a distribution coverage ratio of 1.39 times -- meaning it generates nearly 40% more cash than it needs to pay its dividend -- its payout both is secure and has plenty of room to grow. Management is using that excess cash to help pay for growth, too. The company has $6 billion in growth projects to bring fast-growing West Texas and Oklahoma oil and natural gas plays to market. As a leader in this region already, ONEOK is able to build off its existing infrastructure strength to help oil and gas producers more quickly -- and cheaply -- bring their products to market.
Brookfield Infrastructure is similarly leveraging increased demand for natural gas to deliver big growth. Funds from operations in its energy segment have increased 23% over the past year, primarily due to investments in acquiring and expanding its natural gas transportation business. But this is only one part of what Brookfield Infrastructure does. The master limited partnership also owns telecommunications, water infrastructure and utilities, toll roads, and seaborne ports around the world.
While it operates in developed markets as well, Brookfield Infrastructure is also actively investing in some of the world's fastest-growing economies, too, places where the world's urban middle class is burgeoning. Access to telecommunications, water, transportation, and energy will drive the world's economy for decades to come, and few dividend investments are as well positioned to participate in that growth as Brookfield Infrastructure. Over the past decade, management has done incredibly well by its investors, increasing the payout about 11% per year on average. The long-term goal is to raise it 5% to 9% per year, well ahead of inflation. With top-notch management allocating capital with the best of them and a huge opportunity for years of growth, Brookfield Infrastructure is a clear top dividend stock.
After the 2017 acquisition of a majority stake by Brookfield Asset Management following the bankruptcy of its former majority owner, TerraForm Power is now a vastly improved company with new leadership that's already made big changes to drive down costs and grow profits.
In the first year following the acquisition, TerraForm Power's portfolio of solar- and wind-power-generating facilities grew by more than 40%. Moreover, it has 95% of the power those facilities will produce locked up in long-term contracts with an average length of 14 years. That's an enormously predictable source of cash flows over the next decade-plus. At the same time it has substantially grown its asset base, TerraForm Power is taking steps that will lower its expenses by tens of millions, while its cash inflows are growing.
Combined, management expects these actions will allow the company to grow its dividend between 5% and 9% per year over the long term. Considering that wind and solar continue to take the lion's share of global power production growth, TerraForm Power could make for the best high-yield dividend growth stock investors can find over the next decade.
A top housing and healthcare dividend stock
One of the biggest trends that will affect the next two decades in the U.S. is the aging of America's baby boomers. This generation, which still holds the record of most populous in American history at its peak, only recently fell to No. 2 behind millennials as older boomers start to die.
But in the decades to come, the aging of this generation will have major fundamental impacts on the U.S. economy, housing, and healthcare. By 2029, it is estimated that the number of 65-plus and 80-plus Americans will reach 80 million and 40 million, respectively -- double the population in that age range in 2010. It's going to take substantially more high-quality housing that meets their physical, emotional, and healthcare needs than is currently in existence.
CareTrust REIT, a relatively small player in the space, is well positioned to be one of the biggest winners. Since being spun out of Ensign Group in 2014, CareTrust has almost tripled its real estate holdings, taking advantage of a weak and very unconsolidated market to grow. Under CEO Greg Stapley (an Ensign co-founder who helped select the properties CareTrust took with it in the spinout), CareTrust has done an incredible job of allocating capital as a public company while far exceeding the minimum dividend -- 90% of GAAP earnings -- that REIT rules require it to pay.
Since paying its first regular dividend in late 2014 (there was a special dividend paid as part of the spinoff from Ensign), CareTrust has increased the payout every year. It's up almost 65% in less than five years yet still only takes up about 65% of expected 2018 full-year funds from operations. This gives it a substantial cushion to support the dividend and even continue raising the payout and also gives management a nice cash-flow cushion to pay for future growth.
But as Stapley demonstrated throughout 2018, this isn't a management team that's going to overpay for growth. With a few notable exceptions, CareTrust significantly slowed its acquisitions in 2018 when deals got too expensive; the value of its real estate assets only increased by $37 million -- about 3% -- during the course of the year.
This lack of growth should be viewed in a positive light: The discipline to walk away from overpriced deals will almost assuredly pay off over the long term. To paraphrase Warren Buffett, success in business and investing is more a measure of the deals you say "no" to than the ones you say "yes" to. If you're looking to build a position in a successful dividend growth stock, CareTrust is worth owning at the right price.
Trading for more than 15 times FFO at recent prices, it's not exactly cheap, but it's such a high-quality REIT that I'd make the suggestion it's still worth buying at this price and potentially adding to if Mr. Market gives you a better entry point.
Timely buys that should pay off big over the long term
At this writing, the stock market has fallen more than 15% from the recent peak, as uncertainty about a litany of things ranging from rising interest rates to slowing global trade has investors fearful. Furthermore, nobody is able to reliably predict whether the market will start to recover next week or even next year. But chances are, if we fast-forward 5 or 10 years, nobody will remember this minor speed bump any more than the dozen that came before it, and that means that the best thing most of us can do is take advantage of it as an opportunity to buy and then hold.
Whether you're looking to utilize dividend stocks to build wealth or generate income, building a portfolio with a strategy of investing in high-quality dividend stocks at reasonable prices should pay off well. Taking it a step further, utilizing DRIPs -- that is, reinvesting your dividends in more shares of the companies you own to increase your position -- can really supercharge your portfolio. Simply put, it's a powerful way to deliver amazing compound returns, as each new share you buy adds even more dividends to fuel the next reinvestment.
It won't happen overnight, but this simple strategy can generate a lot of wealth for people who are patient enough to let time do the heavy lifting.
More From The Motley Fool
Jason Hall owns shares of Brookfield Infrastructure Partners, CareTrust REIT, General Motors, and TerraForm Power. The Motley Fool owns shares of Brookfield Asset Management. The Motley Fool recommends Brookfield Infrastructure Partners, Ford, ONEOK, and Verizon Communications. The Motley Fool has a disclosure policy.
