With 87% ownership, CME Group Inc. (NASDAQ:CME) boasts of strong institutional backing
To get a sense of who is truly in control of CME Group Inc. (NASDAQ:CME), it is important to understand the ownership structure of the business. With 87% stake, institutions possess the maximum shares in the company. That is, the group stands to benefit the most if the stock rises (or lose the most if there is a downturn).
Since institutional have access to huge amounts of capital, their market moves tend to receive a lot of scrutiny by retail or individual investors. Hence, having a considerable amount of institutional money invested in a company is often regarded as a desirable trait.
Let's delve deeper into each type of owner of CME Group, beginning with the chart below.
View our latest analysis for CME Group

What Does The Institutional Ownership Tell Us About CME Group?
Institutional investors commonly compare their own returns to the returns of a commonly followed index. So they generally do consider buying larger companies that are included in the relevant benchmark index.
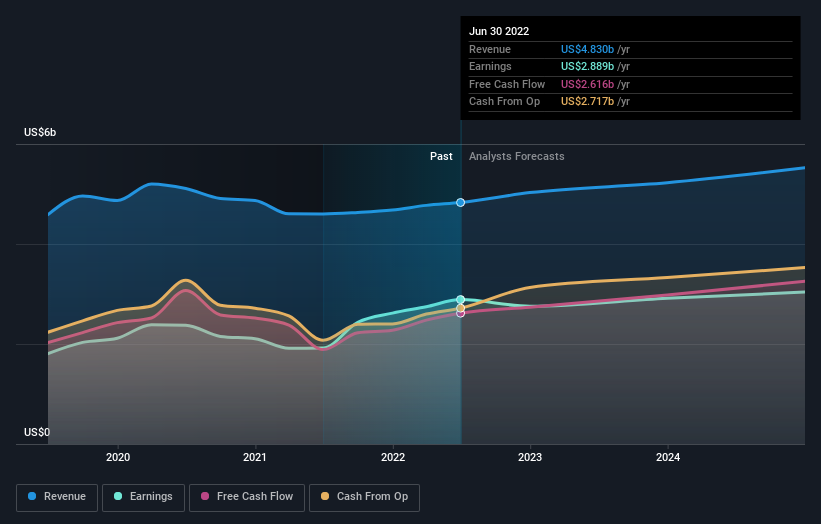
CME Group already has institutions on the share registry. Indeed, they own a respectable stake in the company. This implies the analysts working for those institutions have looked at the stock and they like it. But just like anyone else, they could be wrong. When multiple institutions own a stock, there's always a risk that they are in a 'crowded trade'. When such a trade goes wrong, multiple parties may compete to sell stock fast. This risk is higher in a company without a history of growth. You can see CME Group's historic earnings and revenue below, but keep in mind there's always more to the story.
Institutional investors own over 50% of the company, so together than can probably strongly influence board decisions. CME Group is not owned by hedge funds. Capital Research and Management Company is currently the largest shareholder, with 15% of shares outstanding. Meanwhile, the second and third largest shareholders, hold 9.0% and 6.8%, of the shares outstanding, respectively.
After doing some more digging, we found that the top 14 have the combined ownership of 50% in the company, suggesting that no single shareholder has significant control over the company.
While it makes sense to study institutional ownership data for a company, it also makes sense to study analyst sentiments to know which way the wind is blowing. There are plenty of analysts covering the stock, so it might be worth seeing what they are forecasting, too.
Insider Ownership Of CME Group
The definition of an insider can differ slightly between different countries, but members of the board of directors always count. Company management run the business, but the CEO will answer to the board, even if he or she is a member of it.
Most consider insider ownership a positive because it can indicate the board is well aligned with other shareholders. However, on some occasions too much power is concentrated within this group.
Our information suggests that CME Group Inc. insiders own under 1% of the company. As it is a large company, we'd only expect insiders to own a small percentage of it. But it's worth noting that they own US$216m worth of shares. It is always good to see at least some insider ownership, but it might be worth checking if those insiders have been selling.
General Public Ownership
The general public, who are usually individual investors, hold a 12% stake in CME Group. This size of ownership, while considerable, may not be enough to change company policy if the decision is not in sync with other large shareholders.
Next Steps:
While it is well worth considering the different groups that own a company, there are other factors that are even more important. Take risks for example - CME Group has 2 warning signs we think you should be aware of.
If you are like me, you may want to think about whether this company will grow or shrink. Luckily, you can check this free report showing analyst forecasts for its future.
NB: Figures in this article are calculated using data from the last twelve months, which refer to the 12-month period ending on the last date of the month the financial statement is dated. This may not be consistent with full year annual report figures.
Have feedback on this article? Concerned about the content? Get in touch with us directly. Alternatively, email editorial-team (at) simplywallst.com.
This article by Simply Wall St is general in nature. We provide commentary based on historical data and analyst forecasts only using an unbiased methodology and our articles are not intended to be financial advice. It does not constitute a recommendation to buy or sell any stock, and does not take account of your objectives, or your financial situation. We aim to bring you long-term focused analysis driven by fundamental data. Note that our analysis may not factor in the latest price-sensitive company announcements or qualitative material. Simply Wall St has no position in any stocks mentioned.
Join A Paid User Research Session
You’ll receive a US$30 Amazon Gift card for 1 hour of your time while helping us build better investing tools for the individual investors like yourself. Sign up here
