Has ACCO Brands Corporation (NYSE:ACCO) Improved Earnings In Recent Times?

Measuring ACCO Brands Corporation’s (NYSE:ACCO) track record of past performance is a valuable exercise for investors. It allows us to understand whether or not the company has met or exceed expectations, which is an insightful signal for future performance. Today I will assess ACCO’s recent performance announced on 30 June 2018 and compare these figures to its historical trend and industry movements.
See our latest analysis for ACCO Brands
How Did ACCO’s Recent Performance Stack Up Against Its Past?
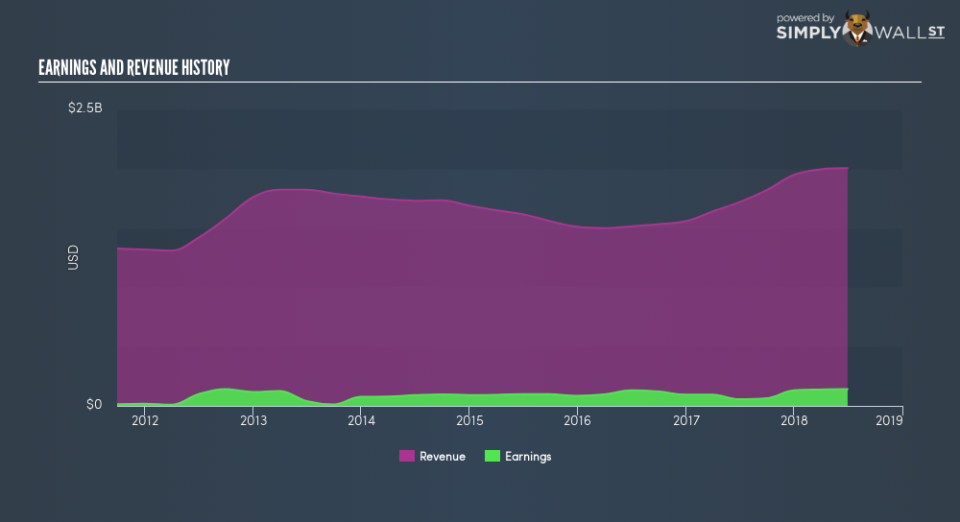
ACCO’s trailing twelve-month earnings (from 30 June 2018) of US$140.70m has more than doubled from US$95.50m in the prior year. Furthermore, this one-year growth rate has exceeded its 5-year annual growth average of 10.80%, indicating the rate at which ACCO is growing has accelerated. How has it been able to do this? Let’s take a look at whether it is only owing to industry tailwinds, or if ACCO Brands has seen some company-specific growth.
In the past few years, ACCO Brands grew its bottom line faster than revenue by effectively controlling its costs. This has caused a margin expansion and profitability over time. Eyeballing growth from a sector-level, the US commercial services industry has been growing, albeit, at a subdued single-digit rate of 4.73% over the past year, and a substantial 10.80% over the past five. This growth is a median of profitable companies of 25 Commercial Services companies in US including Rentokil Initial, Rentokil Initial and OYO. This means that any near-term headwind the industry is experiencing, ACCO Brands is relatively better-cushioned than its peers.
In terms of returns from investment, ACCO Brands has fallen short of achieving a 20% return on equity (ROE), recording 18.80% instead. However, its return on assets (ROA) of 6.17% exceeds the US Commercial Services industry of 5.98%, indicating ACCO Brands has used its assets more efficiently. Though, its return on capital (ROC), which also accounts for ACCO Brands’s debt level, has declined over the past 3 years from 8.70% to 8.53%.
What does this mean?
ACCO Brands’s track record can be a valuable insight into its earnings performance, but it certainly doesn’t tell the whole story. Companies that have performed well in the past, such as ACCO Brands gives investors conviction. However, the next step would be to assess whether the future looks as optimistic. I recommend you continue to research ACCO Brands to get a more holistic view of the stock by looking at:
Future Outlook: What are well-informed industry analysts predicting for ACCO’s future growth? Take a look at our free research report of analyst consensus for ACCO’s outlook.
Financial Health: Are ACCO’s operations financially sustainable? Balance sheets can be hard to analyze, which is why we’ve done it for you. Check out our financial health checks here.
Other High-Performing Stocks: Are there other stocks that provide better prospects with proven track records? Explore our free list of these great stocks here.
NB: Figures in this article are calculated using data from the trailing twelve months from 30 June 2018. This may not be consistent with full year annual report figures.
To help readers see past the short term volatility of the financial market, we aim to bring you a long-term focused research analysis purely driven by fundamental data. Note that our analysis does not factor in the latest price-sensitive company announcements.
The author is an independent contributor and at the time of publication had no position in the stocks mentioned. For errors that warrant correction please contact the editor at editorial-team@simplywallst.com.
