Activision (ATVI) Q2 Earnings Up Y/Y on Steady Top-Line Growth
Activision Blizzard’s ATVI second-quarter 2021 non-GAAP earnings of $1.20 per share increased 48.1% year over year.
Consolidated revenues increased 18.8% year over year to $2.29 billion. Adjusting for revenues from non-reportable segments, net effect from the recognition of deferred revenues and elimination of intersegment revenues, total revenues declined 7.5% year over year to $1.85 billion.
The Zacks Consensus Estimate for earnings and revenues was pegged at 76 cents per share and $1.88 billion, respectively.
For the quarter ended Jun 30, 2021, overall Monthly Active Users (MAUs) were 408 million compared with 428 million as of Jun 30, 2020.
Activision Blizzard’s net bookings decreased 7.6% year over year to $1.92 billion. In-game net bookings were $1.31 billion, down 4% year over year.
In-game net bookings on console and PC grew more than 60% year over year in the second quarter.
Activision Blizzard, Inc Price, Consensus and EPS Surprise
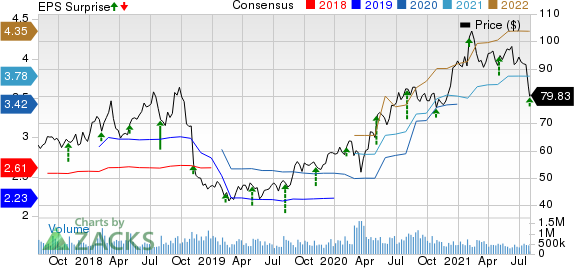
Activision Blizzard, Inc price-consensus-eps-surprise-chart | Activision Blizzard, Inc Quote
Top-Line Details
Product sales (24.7% of revenues) were $568 million, up 6.6% year over year. In-game, subscriptions and other revenues (75.3% of revenues) increased 23.5% to $1.72 billion.
Based on distribution channels, Activision Blizzard reported digital online revenues of $2.02 billion, up 27.3% year over year. However, retail channel sales of $137 million were down 18.5% from the year-ago quarter. Other revenues decreased 23.1% year over year to $133 million.
On the basis of platforms, revenues from mobile and ancillary (34.6% of revenues) rose 27.8% year over year to $795 million. PC revenues (27.4% of revenues) increased 30.3% year over year to $628 million. Moreover, revenues from console (32.2% of revenues) increased 13% year over year to $740 million.
On a geographic basis, revenues from the Americas (58.6% of revenues) were up 21% year over year to $1.34 billion. Europe, the Middle East and Africa revenues (30.3% of revenues) were up 13% year over year to $695 million. Revenues from Asia Pacific (11.1% of revenues) increased 24.4% year over year to $255 million.
Segment Details
Activision (42.5% of revenues) revenues decreased 20.5% year over year to $789 million. The division had 127 million MAUs as of Jun 30, 2021, up 1.6% year over year.
The segment’s top-line growth was driven by Call of Duty: Black Ops Cold War and Warzone in-game revenues, strong premium sales, and Call of Duty Mobile.
For Call of Duty Mobile, net bookings grew in double-digit percentages year over year, driven by strong execution in seasonal content in the West and the recent launch of the game in China. Per company, Call of Duty Mobile is on track to exceed $1 billion in consumer spending for the year.
Blizzard (23.3% of revenues) revenues of $433 million decreased 6.1% from the year-ago quarter driven by strong growth in the Warcraft franchise, especially World of Warcraft’s Shadowlands. Blizzard had 26 million MAUs as of Jun 30, 2021, which decreased 18.8% year over year.
World of Warcraft net bookings grew a double-digit percentage year over year, driven by the launch of Burning Crusade Classic.
The latest expansion of the Hearthstone franchise, Forged in the Barrens, delivered expansion-over-expansion net bookings growth for the second consecutive release following its March launch.
King’s (34.2% of revenues) revenues of $635 million increased 14.8% year over year. MAUs were 255 million as of Jun 30, 2021, which declined 5.9% year over year.
The business saw ongoing year-over-year growth in franchise payers and investment per payer. Candy Crush was once again the top grossing franchise in U.S. app stores during second-quarter 2021.
King’s ongoing initiatives to enhance its ad platform, work with more demand partners and reach more categories of advertisers drove year-over-year growth in both volume and pricing, with broad-based strength across geographies.
Operating Details
Product development expense increased 13.2% year over year to $317 million. General & administrative expenses were up 14.8% year over year to $171 million.
Sales & marketing expenses were $242 million, up 2.5% year over year.
Total costs & expenses on a non-GAAP basis increased 14.1% year over year to $1.27 billion in the reported quarter.
On a non-GAAP basis, operating income was $1.01 billion, up 25.4% year over year.
Balance Sheet & Cash Flow
As of Jun 30, 2021, cash and cash equivalents were $9.20 billion compared with $9.28 billion as of Mar 31, 2021.
Long-term debt as of Jun 30, 2021 was $3.60 billion, which remained unchanged sequentially.
Operating cash flow declined 49.5% year over year to $388 million. Free cash flow declined 50.5% year over year to $374 million.
On a trailing 12-month basis, free cash flow increased 22% to $2.48 billion.
Guidance
For third-quarter 2021, Activision Blizzard expects non-GAAP revenues of $1.97 billion and earnings of 75 cents per share. Net bookings are expected to be $1.85 billion.
For 2021, Activision Blizzard anticipates non-GAAP revenues of $8.51 billion and earnings of $3.54 per share. Net bookings are expected to be $8.65 billion.
Zacks Rank & Stocks to Consider
Activision Blizzard currently carries a Zacks Rank #3 (Hold).
Entravision Communications Corporation EVC, Penn National Gaming, Inc. PENN and PlayAGS, Inc. AGS are some better-ranked stocks in the broader consumer & discretionary sector, each carrying a Zacks Rank #2 (Buy). You can see the complete list of today’s Zacks #1 Rank (Strong Buy) stocks here.
Entravision Communications, Penn Gaming and PlayAGS are each set to report quarterly results on Aug 5.
Want the latest recommendations from Zacks Investment Research? Today, you can download 7 Best Stocks for the Next 30 Days. Click to get this free report
Activision Blizzard, Inc (ATVI) : Free Stock Analysis Report
Penn National Gaming, Inc. (PENN) : Free Stock Analysis Report
Entravision Communications Corporation (EVC) : Free Stock Analysis Report
PlayAGS, Inc. (AGS) : Free Stock Analysis Report
To read this article on Zacks.com click here.
Zacks Investment Research
