Adobe Inc. (NASDAQ:ADBE) Earns Among The Best Returns In Its Industry

Want to participate in a short research study? Help shape the future of investing tools and you could win a $250 gift card!
Today we'll look at Adobe Inc. (NASDAQ:ADBE) and reflect on its potential as an investment. In particular, we'll consider its Return On Capital Employed (ROCE), as that can give us insight into how profitably the company is able to employ capital in its business.
First up, we'll look at what ROCE is and how we calculate it. Next, we'll compare it to others in its industry. And finally, we'll look at how its current liabilities are impacting its ROCE.
Understanding Return On Capital Employed (ROCE)
ROCE measures the amount of pre-tax profits a company can generate from the capital employed in its business. In general, businesses with a higher ROCE are usually better quality. Ultimately, it is a useful but imperfect metric. Author Edwin Whiting says to be careful when comparing the ROCE of different businesses, since 'No two businesses are exactly alike.'
So, How Do We Calculate ROCE?
The formula for calculating the return on capital employed is:
Return on Capital Employed = Earnings Before Interest and Tax (EBIT) ÷ (Total Assets - Current Liabilities)
Or for Adobe:
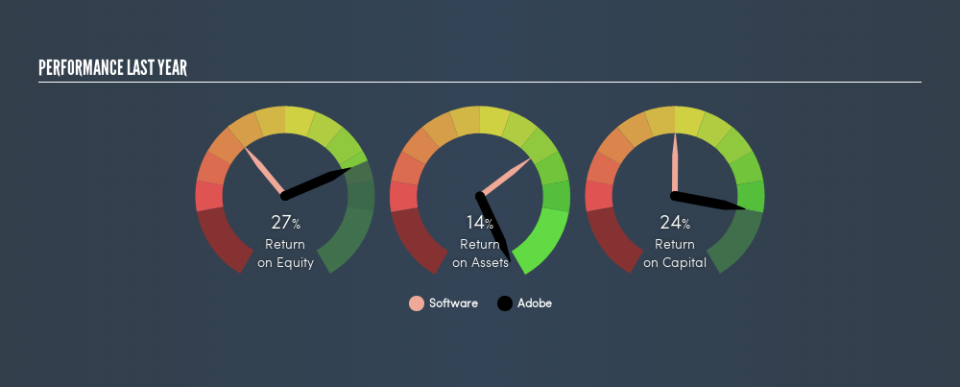
0.24 = US$2.9b ÷ (US$20b - US$7.7b) (Based on the trailing twelve months to May 2019.)
So, Adobe has an ROCE of 24%.
Check out our latest analysis for Adobe
Is Adobe's ROCE Good?
One way to assess ROCE is to compare similar companies. Adobe's ROCE appears to be substantially greater than the 9.5% average in the Software industry. I think that's good to see, since it implies the company is better than other companies at making the most of its capital. Regardless of the industry comparison, in absolute terms, Adobe's ROCE currently appears to be excellent.
Our data shows that Adobe currently has an ROCE of 24%, compared to its ROCE of 12% 3 years ago. This makes us wonder if the company is improving. You can see in the image below how Adobe's ROCE compares to its industry. Click to see more on past growth.
Remember that this metric is backwards looking - it shows what has happened in the past, and does not accurately predict the future. ROCE can be deceptive for cyclical businesses, as returns can look incredible in boom times, and terribly low in downturns. ROCE is only a point-in-time measure. Since the future is so important for investors, you should check out our free report on analyst forecasts for Adobe.
How Adobe's Current Liabilities Impact Its ROCE
Short term (or current) liabilities, are things like supplier invoices, overdrafts, or tax bills that need to be paid within 12 months. Due to the way ROCE is calculated, a high level of current liabilities makes a company look as though it has less capital employed, and thus can (sometimes unfairly) boost the ROCE. To check the impact of this, we calculate if a company has high current liabilities relative to its total assets.
Adobe has total liabilities of US$7.7b and total assets of US$20b. Therefore its current liabilities are equivalent to approximately 39% of its total assets. Adobe has a medium level of current liabilities, boosting its ROCE somewhat.
What We Can Learn From Adobe's ROCE
Despite this, it reports a high ROCE, and may be worth investigating further. Adobe shapes up well under this analysis, but it is far from the only business delivering excellent numbers . You might also want to check this free collection of companies delivering excellent earnings growth.
For those who like to find winning investments this free list of growing companies with recent insider purchasing, could be just the ticket.
We aim to bring you long-term focused research analysis driven by fundamental data. Note that our analysis may not factor in the latest price-sensitive company announcements or qualitative material.
If you spot an error that warrants correction, please contact the editor at editorial-team@simplywallst.com. This article by Simply Wall St is general in nature. It does not constitute a recommendation to buy or sell any stock, and does not take account of your objectives, or your financial situation. Simply Wall St has no position in the stocks mentioned. Thank you for reading.
