What AerCap Holdings N.V.'s (NYSE:AER) ROE Can Tell Us

One of the best investments we can make is in our own knowledge and skill set. With that in mind, this article will work through how we can use Return On Equity (ROE) to better understand a business. We'll use ROE to examine AerCap Holdings N.V. (NYSE:AER), by way of a worked example.
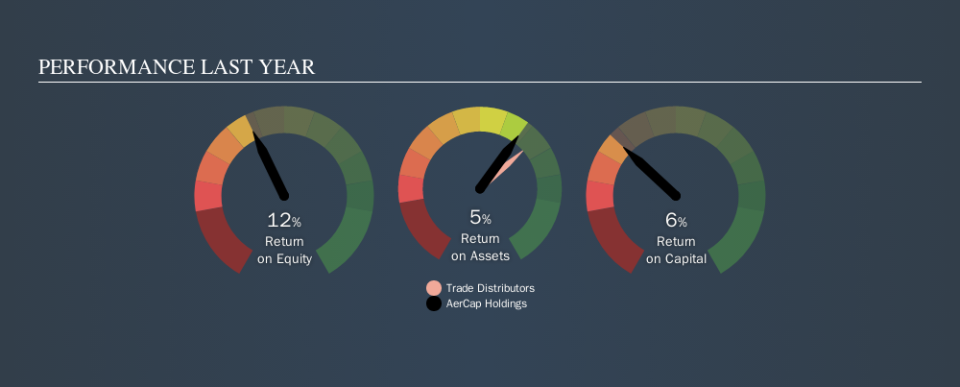
AerCap Holdings has a ROE of 12%, based on the last twelve months. That means that for every $1 worth of shareholders' equity, it generated $0.12 in profit.
Check out our latest analysis for AerCap Holdings
How Do You Calculate ROE?
The formula for return on equity is:
Return on Equity = Net Profit ÷ Shareholders' Equity
Or for AerCap Holdings:
12% = US$1.1b ÷ US$9.1b (Based on the trailing twelve months to June 2019.)
Most readers would understand what net profit is, but it’s worth explaining the concept of shareholders’ equity. It is the capital paid in by shareholders, plus any retained earnings. Shareholders' equity can be calculated by subtracting the total liabilities of the company from the total assets of the company.
What Does ROE Mean?
Return on Equity measures a company's profitability against the profit it has kept for the business (plus any capital injections). The 'return' is the amount earned after tax over the last twelve months. The higher the ROE, the more profit the company is making. So, all else being equal, a high ROE is better than a low one. Clearly, then, one can use ROE to compare different companies.
Does AerCap Holdings Have A Good Return On Equity?
By comparing a company's ROE with its industry average, we can get a quick measure of how good it is. Importantly, this is far from a perfect measure, because companies differ significantly within the same industry classification. You can see in the graphic below that AerCap Holdings has an ROE that is fairly close to the average for the Trade Distributors industry (12%).
That isn't amazing, but it is respectable. ROE doesn't tell us if the share price is low, but it can inform us to the nature of the business. For those looking for a bargain, other factors may be more important. If you like to buy stocks alongside management, then you might just love this free list of companies. (Hint: insiders have been buying them).
How Does Debt Impact Return On Equity?
Most companies need money -- from somewhere -- to grow their profits. That cash can come from retained earnings, issuing new shares (equity), or debt. In the first and second cases, the ROE will reflect this use of cash for investment in the business. In the latter case, the use of debt will improve the returns, but will not change the equity. That will make the ROE look better than if no debt was used.
AerCap Holdings's Debt And Its 12% ROE
It appears that AerCap Holdings makes extensive use of debt to improve its returns, because it has a relatively high debt to equity ratio of 3.19. Its ROE is respectable, but it's not so impressive once you consider all of the debt.
The Bottom Line On ROE
Return on equity is one way we can compare the business quality of different companies. A company that can achieve a high return on equity without debt could be considered a high quality business. If two companies have around the same level of debt to equity, and one has a higher ROE, I'd generally prefer the one with higher ROE.
But when a business is high quality, the market often bids it up to a price that reflects this. The rate at which profits are likely to grow, relative to the expectations of profit growth reflected in the current price, must be considered, too. So you might want to check this FREE visualization of analyst forecasts for the company.
If you would prefer check out another company -- one with potentially superior financials -- then do not miss thisfree list of interesting companies, that have HIGH return on equity and low debt.
We aim to bring you long-term focused research analysis driven by fundamental data. Note that our analysis may not factor in the latest price-sensitive company announcements or qualitative material.
If you spot an error that warrants correction, please contact the editor at editorial-team@simplywallst.com. This article by Simply Wall St is general in nature. It does not constitute a recommendation to buy or sell any stock, and does not take account of your objectives, or your financial situation. Simply Wall St has no position in the stocks mentioned. Thank you for reading.
