Is Agilent Technologies Inc’s (NYSE:A) Balance Sheet Strong Enough To Weather A Storm?

The size of Agilent Technologies Inc (NYSE:A), a US$21.61B large-cap, often attracts investors seeking a reliable investment in the stock market. One reason being its ‘too big to fail’ aura which gives it the appearance of a strong and stable investment. However, the key to their continued success lies in its financial health. Let’s take a look at Agilent Technologies’s leverage and assess its financial strength to get an idea of their ability to fund strategic acquisitions and grow through cyclical pressures. Note that this commentary is very high-level and solely focused on financial health, so I suggest you dig deeper yourself into A here. View our latest analysis for Agilent Technologies
How much cash does A generate through its operations?
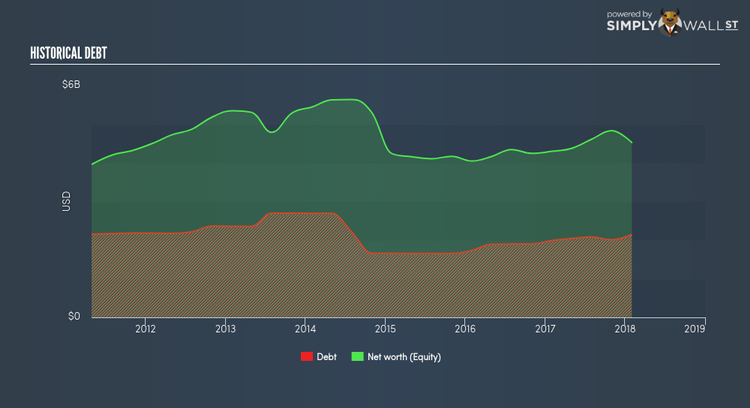
Over the past year, A has ramped up its debt from US$1.90B to US$2.01B , which is made up of current and long term debt. With this growth in debt, A’s cash and short-term investments stands at US$2.68B for investing into the business. On top of this, A has generated US$889.00M in operating cash flow in the last twelve months, resulting in an operating cash to total debt ratio of 44.21%, meaning that A’s debt is appropriately covered by operating cash. This ratio can also be a sign of operational efficiency as an alternative to return on assets. In A’s case, it is able to generate 0.44x cash from its debt capital.
Can A meet its short-term obligations with the cash in hand?
Looking at A’s most recent US$1.26B liabilities, the company has maintained a safe level of current assets to meet its obligations, with the current ratio last standing at 3.3x. Though, anything about 3x may be excessive, since A may be leaving too much capital in low-earning investments.
Does A face the risk of succumbing to its debt-load?
A is a relatively highly levered company with a debt-to-equity of 47.39%. This is common amongst large-cap companies because debt can often be a less expensive alternative to equity due to tax deductibility of interest payments. Accordingly, large companies often have lower cost of capital due to easily obtained financing, providing an advantage over smaller companies. No matter how high the company’s debt, if it can easily cover the interest payments, it’s considered to be efficient with its use of excess leverage. Preferably, earnings before interest and tax (EBIT) should be at least three times as large as net interest. For A, the ratio of 17.62x suggests that interest is comfortably covered. High interest coverage is seen as a responsible and safe practice, which highlights why most investors believe large-caps such as A is a safe investment.
Next Steps:
Although A’s debt level is towards the higher end of the spectrum, its cash flow coverage seems adequate to meet obligations which means its debt is being efficiently utilised. Since there is also no concerns around A’s liquidity needs, this may be its optimal capital structure for the time being. Keep in mind I haven’t considered other factors such as how A has been performing in the past. You should continue to research Agilent Technologies to get a more holistic view of the large-cap by looking at:
Future Outlook: What are well-informed industry analysts predicting for A’s future growth? Take a look at our free research report of analyst consensus for A’s outlook.
Valuation: What is A worth today? Is the stock undervalued, even when its growth outlook is factored into its intrinsic value? The intrinsic value infographic in our free research report helps visualize whether A is currently mispriced by the market.
Other High-Performing Stocks: Are there other stocks that provide better prospects with proven track records? Explore our free list of these great stocks here.
To help readers see pass the short term volatility of the financial market, we aim to bring you a long-term focused research analysis purely driven by fundamental data. Note that our analysis does not factor in the latest price sensitive company announcements.
The author is an independent contributor and at the time of publication had no position in the stocks mentioned.
