Here’s What Agritrade Resources Limited’s (HKG:1131) P/E Is Telling Us

Want to participate in a short research study? Help shape the future of investing tools and receive a $20 prize!
This article is for investors who would like to improve their understanding of price to earnings ratios (P/E ratios). We’ll show how you can use Agritrade Resources Limited’s (HKG:1131) P/E ratio to inform your assessment of the investment opportunity. Based on the last twelve months, Agritrade Resources’s P/E ratio is 22.02. That corresponds to an earnings yield of approximately 4.5%.
Check out our latest analysis for Agritrade Resources
How Do You Calculate A P/E Ratio?
The formula for price to earnings is:
Price to Earnings Ratio = Share Price ÷ Earnings per Share (EPS)
Or for Agritrade Resources:
P/E of 22.02 = HK$1.49 ÷ HK$0.068 (Based on the trailing twelve months to September 2018.)
Is A High Price-to-Earnings Ratio Good?
A higher P/E ratio means that investors are paying a higher price for each HK$1 of company earnings. That isn’t necessarily good or bad, but a high P/E implies relatively high expectations of what a company can achieve in the future.
How Growth Rates Impact P/E Ratios
P/E ratios primarily reflect market expectations around earnings growth rates. That’s because companies that grow earnings per share quickly will rapidly increase the ‘E’ in the equation. Therefore, even if you pay a high multiple of earnings now, that multiple will become lower in the future. A lower P/E should indicate the stock is cheap relative to others — and that may attract buyers.
Agritrade Resources increased earnings per share by a whopping 69% last year. And it has bolstered its earnings per share by 16% per year over the last five years. So we’d generally expect it to have a relatively high P/E ratio.
How Does Agritrade Resources’s P/E Ratio Compare To Its Peers?
The P/E ratio essentially measures market expectations of a company. You can see in the image below that the average P/E (11.6) for companies in the oil and gas industry is lower than Agritrade Resources’s P/E.
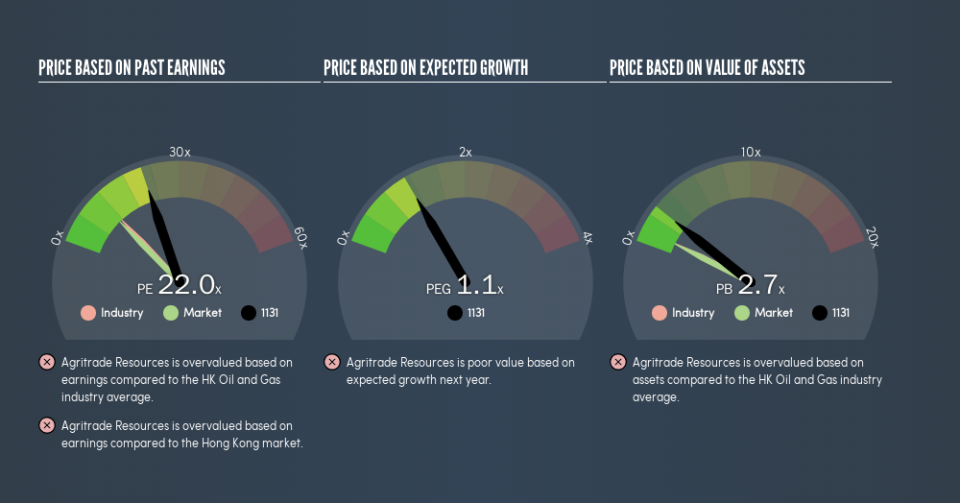
That means that the market expects Agritrade Resources will outperform other companies in its industry. The market is optimistic about the future, but that doesn’t guarantee future growth. So investors should delve deeper. I like to check if company insiders have been buying or selling.
Don’t Forget: The P/E Does Not Account For Debt or Bank Deposits
Don’t forget that the P/E ratio considers market capitalization. Thus, the metric does not reflect cash or debt held by the company. Theoretically, a business can improve its earnings (and produce a lower P/E in the future), by taking on debt (or spending its remaining cash).
Such expenditure might be good or bad, in the long term, but the point here is that the balance sheet is not reflected by this ratio.
Agritrade Resources’s Balance Sheet
Since Agritrade Resources holds net cash of HK$27m, it can spend on growth, justifying a higher P/E ratio than otherwise.
The Verdict On Agritrade Resources’s P/E Ratio
Agritrade Resources trades on a P/E ratio of 22, which is above the HK market average of 10.9. Its net cash position supports a higher P/E ratio, as does its solid recent earnings growth. So it is not surprising the market is probably extrapolating recent growth well into the future, reflected in the relatively high P/E ratio.
When the market is wrong about a stock, it gives savvy investors an opportunity. As value investor Benjamin Graham famously said, ‘In the short run, the market is a voting machine but in the long run, it is a weighing machine.’ So this free report on the analyst consensus forecasts could help you make a master move on this stock.
Of course, you might find a fantastic investment by looking at a few good candidates. So take a peek at this free list of companies with modest (or no) debt, trading on a P/E below 20.
We aim to bring you long-term focused research analysis driven by fundamental data. Note that our analysis may not factor in the latest price-sensitive company announcements or qualitative material.
If you spot an error that warrants correction, please contact the editor at editorial-team@simplywallst.com. This article by Simply Wall St is general in nature. It does not constitute a recommendation to buy or sell any stock, and does not take account of your objectives, or your financial situation. Simply Wall St has no position in the stocks mentioned. Thank you for reading.
