Is AMCON Distributing Company’s (NYSEMKT:DIT) P/E Ratio Really That Good?

This article is for investors who would like to improve their understanding of price to earnings ratios (P/E ratios). We’ll look at AMCON Distributing Company’s (NYSEMKT:DIT) P/E ratio and reflect on what it tells us about the company’s share price. AMCON Distributing has a P/E ratio of 15.51, based on the last twelve months. In other words, at today’s prices, investors are paying $15.51 for every $1 in prior year profit.
Check out our latest analysis for AMCON Distributing
How Do You Calculate A P/E Ratio?
The formula for P/E is:
Price to Earnings Ratio = Share Price ÷ Earnings per Share (EPS)
Or for AMCON Distributing:
P/E of 15.51 = $84.84 ÷ $5.47 (Based on the year to September 2018.)
Is A High P/E Ratio Good?
A higher P/E ratio means that buyers have to pay a higher price for each $1 the company has earned over the last year. All else being equal, it’s better to pay a low price — but as Warren Buffett said, ‘It’s far better to buy a wonderful company at a fair price than a fair company at a wonderful price.’
How Growth Rates Impact P/E Ratios
When earnings fall, the ‘E’ decreases, over time. That means unless the share price falls, the P/E will increase in a few years. So while a stock may look cheap based on past earnings, it could be expensive based on future earnings.
AMCON Distributing increased earnings per share by a whopping 26% last year. But earnings per share are down 10% per year over the last five years.
How Does AMCON Distributing’s P/E Ratio Compare To Its Peers?
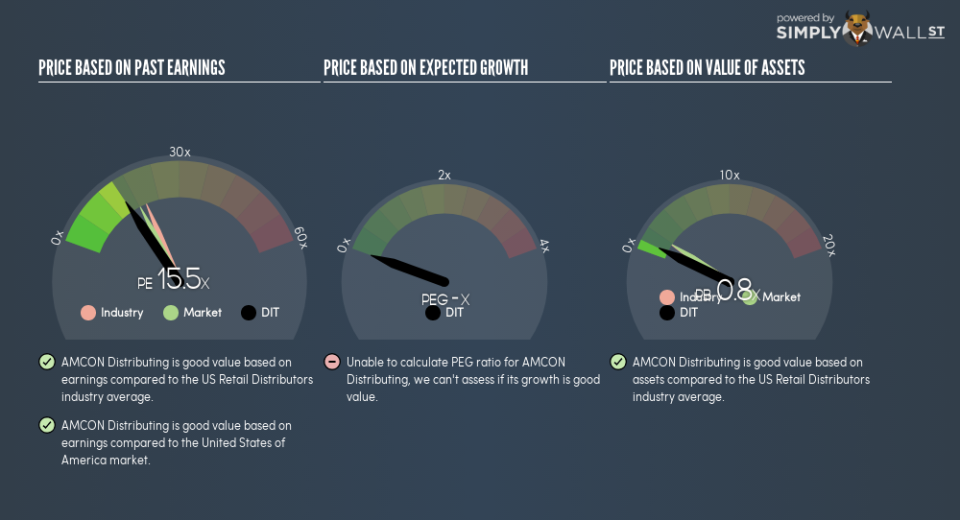
We can get an indication of market expectations by looking at the P/E ratio. If you look at the image below, you can see AMCON Distributing has a lower P/E than the average (20.2) in the retail distributors industry classification.
AMCON Distributing’s P/E tells us that market participants think it will not fare as well as its peers in the same industry. Many investors like to buy stocks when the market is pessimistic about their prospects. It is arguably worth checking if insiders are buying shares, because that might imply they believe the stock is undervalued.
Remember: P/E Ratios Don’t Consider The Balance Sheet
It’s important to note that the P/E ratio considers the market capitalization, not the enterprise value. Thus, the metric does not reflect cash or debt held by the company. Theoretically, a business can improve its earnings (and produce a lower P/E in the future), by taking on debt (or spending its remaining cash).
Spending on growth might be good or bad a few years later, but the point is that the P/E ratio does not account for the option (or lack thereof).
How Does AMCON Distributing’s Debt Impact Its P/E Ratio?
Net debt totals 76% of AMCON Distributing’s market cap. This is enough debt that you’d have to make some adjustments before using the P/E ratio to compare it to a company with net cash.
The Bottom Line On AMCON Distributing’s P/E Ratio
AMCON Distributing’s P/E is 15.5 which is below average (18.2) in the US market. The company may have significant debt, but EPS growth was good last year. If the company can continue to grow earnings, then the current P/E may be unjustifiably low.
When the market is wrong about a stock, it gives savvy investors an opportunity. If the reality for a company is not as bad as the P/E ratio indicates, then the share price should increase as the market realizes this. Although we don’t have analyst forecasts, you could get a better understanding of its growth by checking out this more detailed historical graph of earnings, revenue and cash flow.
Of course you might be able to find a better stock than AMCON Distributing. So you may wish to see this free collection of other companies that have grown earnings strongly.
To help readers see past the short term volatility of the financial market, we aim to bring you a long-term focused research analysis purely driven by fundamental data. Note that our analysis does not factor in the latest price-sensitive company announcements.
The author is an independent contributor and at the time of publication had no position in the stocks mentioned. For errors that warrant correction please contact the editor at editorial-team@simplywallst.com.
