How AMERCO (NASDAQ:UHAL) Delivered A Better ROE Than Its Industry

This article is intended for those of you who are at the beginning of your investing journey and want to begin learning the link between AMERCO (NASDAQ:UHAL)’s return fundamentals and stock market performance.
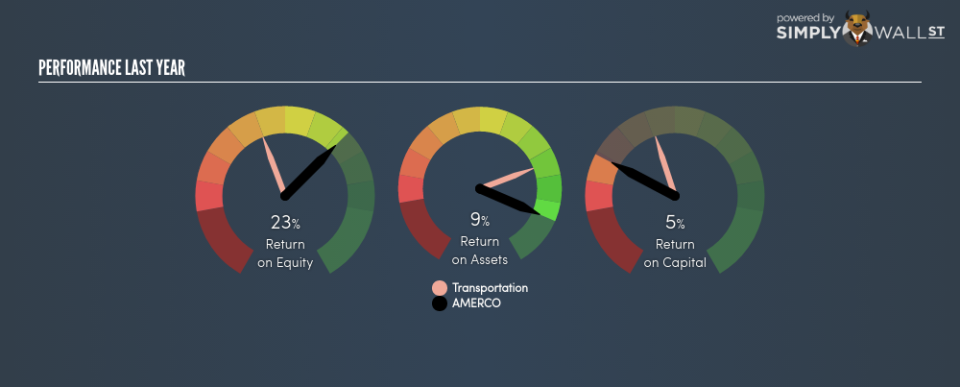
With an ROE of 23.19%, AMERCO (NASDAQ:UHAL) outpaced its own industry which delivered a less exciting 12.69% over the past year. Superficially, this looks great since we know that UHAL has generated big profits with little equity capital; however, ROE doesn’t tell us how much UHAL has borrowed in debt. We’ll take a closer look today at factors like financial leverage to determine whether UHAL’s ROE is actually sustainable. Check out our latest analysis for AMERCO
Peeling the layers of ROE – trisecting a company’s profitability
Firstly, Return on Equity, or ROE, is simply the percentage of last years’ earning against the book value of shareholders’ equity. For example, if the company invests $1 in the form of equity, it will generate $0.23 in earnings from this. Generally speaking, a higher ROE is preferred; however, there are other factors we must also consider before making any conclusions.
Return on Equity = Net Profit ÷ Shareholders Equity
Returns are usually compared to costs to measure the efficiency of capital. AMERCO’s cost of equity is 9.87%. This means AMERCO returns enough to cover its own cost of equity, with a buffer of 13.32%. This sustainable practice implies that the company pays less for its capital than what it generates in return. ROE can be broken down into three different ratios: net profit margin, asset turnover, and financial leverage. This is called the Dupont Formula:
Dupont Formula
ROE = profit margin × asset turnover × financial leverage
ROE = (annual net profit ÷ sales) × (sales ÷ assets) × (assets ÷ shareholders’ equity)
ROE = annual net profit ÷ shareholders’ equity
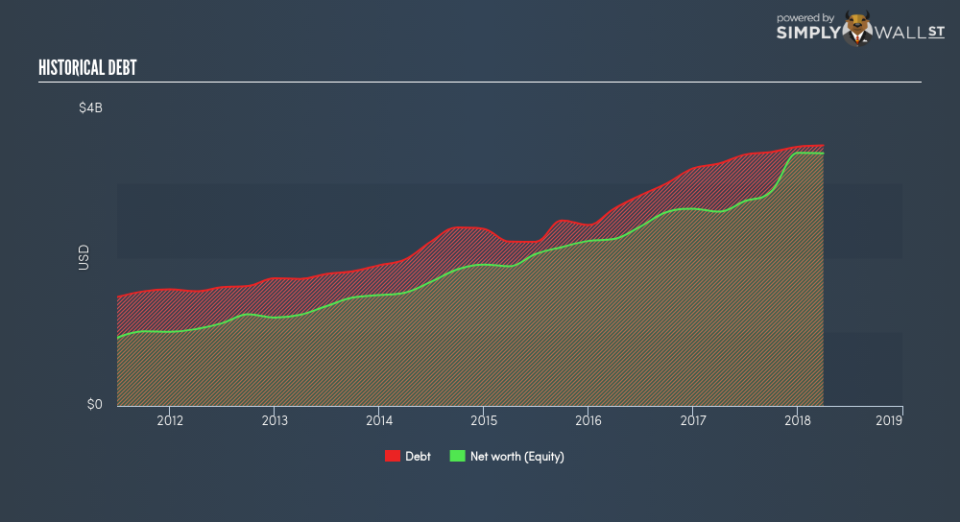
Basically, profit margin measures how much of revenue trickles down into earnings which illustrates how efficient the business is with its cost management. Asset turnover reveals how much revenue can be generated from AMERCO’s asset base. Finally, financial leverage will be our main focus today. It shows how much of assets are funded by equity and can show how sustainable the company’s capital structure is. Since financial leverage can artificially inflate ROE, we need to look at how much debt AMERCO currently has. At 103.08%, AMERCO’s debt-to-equity ratio appears balanced and indicates the above-average ROE is generated from its capacity to increase profit without a large debt burden.
Next Steps:
While ROE is a relatively simple calculation, it can be broken down into different ratios, each telling a different story about the strengths and weaknesses of a company. AMERCO exhibits a strong ROE against its peers, as well as sufficient returns to cover its cost of equity. Its high ROE is not likely to be driven by high debt. Therefore, investors may have more confidence in the sustainability of this level of returns going forward. ROE is a helpful signal, but it is definitely not sufficient on its own to make an investment decision.
For AMERCO, I’ve put together three key factors you should further research:
Financial Health: Does it have a healthy balance sheet? Take a look at our free balance sheet analysis with six simple checks on key factors like leverage and risk.
Valuation: What is AMERCO worth today? Is the stock undervalued, even when its growth outlook is factored into its intrinsic value? The intrinsic value infographic in our free research report helps visualize whether AMERCO is currently mispriced by the market.
Other High-Growth Alternatives : Are there other high-growth stocks you could be holding instead of AMERCO? Explore our interactive list of stocks with large growth potential to get an idea of what else is out there you may be missing!
To help readers see pass the short term volatility of the financial market, we aim to bring you a long-term focused research analysis purely driven by fundamental data. Note that our analysis does not factor in the latest price sensitive company announcements.
The author is an independent contributor and at the time of publication had no position in the stocks mentioned.
