American Airlines Group Inc’s (NASDAQ:AAL) Earnings Dropped -28.29%, Did Its Industry Show Weakness Too?

Examining American Airlines Group Inc’s (NASDAQ:AAL) past track record of performance is a useful exercise for investors. It allows us to reflect on whether the company has met or exceed expectations, which is a powerful signal for future performance. Below, I will assess AAL’s latest performance announced on 31 December 2017 and weight these figures against its longer term trend and industry movements. View our latest analysis for American Airlines Group
Was AAL’s recent earnings decline worse than the long-term trend and the industry?
For the purpose of this commentary, I like to use the ‘latest twelve-month’ data, which annualizes the latest 6-month earnings release, or some times, the latest annual report is already the most recent financial data. This blend allows me to examine different companies on a more comparable basis, using the latest information. For American Airlines Group, its latest trailing-twelve-month earnings is US$1.92B, which, relative to the previous year’s level, has declined by -28.29%. Given that these values may be fairly myopic, I’ve calculated an annualized five-year figure for American Airlines Group’s earnings, which stands at US$1.24B This means although earnings growth was negative from last year, over a longer period of time, American Airlines Group’s profits have been increasing on average.
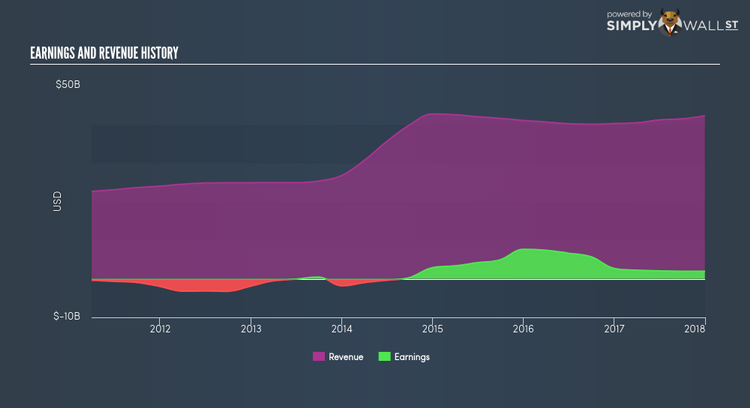
How has it been able to do this? Let’s take a look at whether it is merely attributable to an industry uplift, or if American Airlines Group has experienced some company-specific growth. Over the past couple of years, American Airlines Group increased its bottom line faster than revenue by efficiently controlling its costs. This has caused a margin expansion and profitability over time. Looking at growth from a sector-level, the US airlines industry has been growing, albeit, at a muted single-digit rate of 2.02% over the prior twelve months, and a substantial 15.65% over the past five. This suggests that any recent headwind the industry is enduring, it’s hitting American Airlines Group harder than its peers.
What does this mean?
American Airlines Group’s track record can be a valuable insight into its earnings performance, but it certainly doesn’t tell the whole story. Companies are profitable, but have unpredictable earnings, can have many factors impacting its business. You should continue to research American Airlines Group to get a better picture of the stock by looking at:
1. Future Outlook: What are well-informed industry analysts predicting for AAL’s future growth? Take a look at our free research report of analyst consensus for AAL’s outlook.
2. Financial Health: Is AAL’s operations financially sustainable? Balance sheets can be hard to analyze, which is why we’ve done it for you. Check out our financial health checks here.
3. Other High-Performing Stocks: Are there other stocks that provide better prospects with proven track records? Explore our free list of these great stocks here.
NB: Figures in this article are calculated using data from the trailing twelve months from 31 December 2017. This may not be consistent with full year annual report figures.
To help readers see pass the short term volatility of the financial market, we aim to bring you a long-term focused research analysis purely driven by fundamental data. Note that our analysis does not factor in the latest price sensitive company announcements.
The author is an independent contributor and at the time of publication had no position in the stocks mentioned.
