AMMO (NASDAQ:POWW) Has A Pretty Healthy Balance Sheet
Howard Marks put it nicely when he said that, rather than worrying about share price volatility, 'The possibility of permanent loss is the risk I worry about... and every practical investor I know worries about.' It's only natural to consider a company's balance sheet when you examine how risky it is, since debt is often involved when a business collapses. As with many other companies AMMO, Inc. (NASDAQ:POWW) makes use of debt. But the more important question is: how much risk is that debt creating?
What Risk Does Debt Bring?
Debt is a tool to help businesses grow, but if a business is incapable of paying off its lenders, then it exists at their mercy. In the worst case scenario, a company can go bankrupt if it cannot pay its creditors. However, a more common (but still painful) scenario is that it has to raise new equity capital at a low price, thus permanently diluting shareholders. Having said that, the most common situation is where a company manages its debt reasonably well - and to its own advantage. When we examine debt levels, we first consider both cash and debt levels, together.
See our latest analysis for AMMO
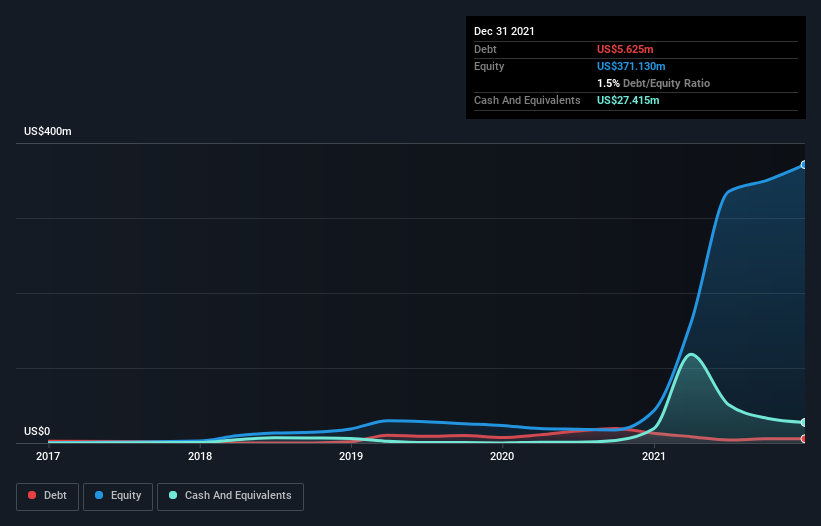
What Is AMMO's Debt?
You can click the graphic below for the historical numbers, but it shows that AMMO had US$5.63m of debt in December 2021, down from US$12.9m, one year before. However, it does have US$27.4m in cash offsetting this, leading to net cash of US$21.8m.
How Healthy Is AMMO's Balance Sheet?
According to the last reported balance sheet, AMMO had liabilities of US$35.6m due within 12 months, and liabilities of US$4.46m due beyond 12 months. Offsetting these obligations, it had cash of US$27.4m as well as receivables valued at US$45.7m due within 12 months. So it actually has US$33.0m more liquid assets than total liabilities.
This short term liquidity is a sign that AMMO could probably pay off its debt with ease, as its balance sheet is far from stretched. Simply put, the fact that AMMO has more cash than debt is arguably a good indication that it can manage its debt safely.
It was also good to see that despite losing money on the EBIT line last year, AMMO turned things around in the last 12 months, delivering and EBIT of US$34m. The balance sheet is clearly the area to focus on when you are analysing debt. But ultimately the future profitability of the business will decide if AMMO can strengthen its balance sheet over time. So if you're focused on the future you can check out this free report showing analyst profit forecasts.
Finally, while the tax-man may adore accounting profits, lenders only accept cold hard cash. While AMMO has net cash on its balance sheet, it's still worth taking a look at its ability to convert earnings before interest and tax (EBIT) to free cash flow, to help us understand how quickly it is building (or eroding) that cash balance. During the last year, AMMO burned a lot of cash. While that may be a result of expenditure for growth, it does make the debt far more risky.
Summing up
While it is always sensible to investigate a company's debt, in this case AMMO has US$21.8m in net cash and a decent-looking balance sheet. So we don't have any problem with AMMO's use of debt. The balance sheet is clearly the area to focus on when you are analysing debt. But ultimately, every company can contain risks that exist outside of the balance sheet. For example, we've discovered 2 warning signs for AMMO (1 is potentially serious!) that you should be aware of before investing here.
When all is said and done, sometimes its easier to focus on companies that don't even need debt. Readers can access a list of growth stocks with zero net debt 100% free, right now.
Have feedback on this article? Concerned about the content? Get in touch with us directly. Alternatively, email editorial-team (at) simplywallst.com.
This article by Simply Wall St is general in nature. We provide commentary based on historical data and analyst forecasts only using an unbiased methodology and our articles are not intended to be financial advice. It does not constitute a recommendation to buy or sell any stock, and does not take account of your objectives, or your financial situation. We aim to bring you long-term focused analysis driven by fundamental data. Note that our analysis may not factor in the latest price-sensitive company announcements or qualitative material. Simply Wall St has no position in any stocks mentioned.
