Is AMN Healthcare Services, Inc.'s (NYSE:AMN) High P/E Ratio A Problem For Investors?

The goal of this article is to teach you how to use price to earnings ratios (P/E ratios). We'll apply a basic P/E ratio analysis to AMN Healthcare Services, Inc.'s (NYSE:AMN), to help you decide if the stock is worth further research. Looking at earnings over the last twelve months, AMN Healthcare Services has a P/E ratio of 19.92. In other words, at today's prices, investors are paying $19.92 for every $1 in prior year profit.
View our latest analysis for AMN Healthcare Services
How Do You Calculate A P/E Ratio?
The formula for price to earnings is:
Price to Earnings Ratio = Price per Share ÷ Earnings per Share (EPS)
Or for AMN Healthcare Services:
P/E of 19.92 = $53.76 ÷ $2.7 (Based on the year to June 2019.)
Is A High P/E Ratio Good?
A higher P/E ratio means that buyers have to pay a higher price for each $1 the company has earned over the last year. All else being equal, it's better to pay a low price -- but as Warren Buffett said, 'It's far better to buy a wonderful company at a fair price than a fair company at a wonderful price.'
Does AMN Healthcare Services Have A Relatively High Or Low P/E For Its Industry?
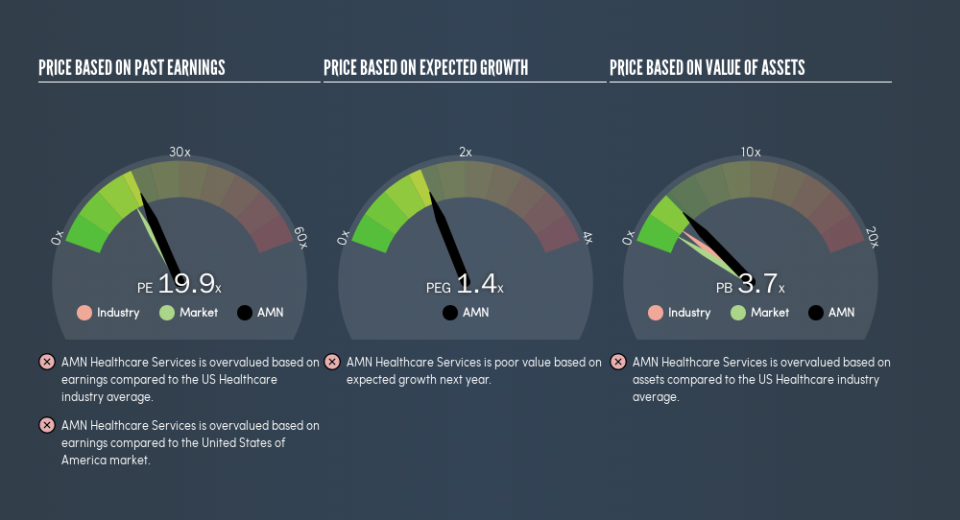
The P/E ratio indicates whether the market has higher or lower expectations of a company. As you can see below AMN Healthcare Services has a P/E ratio that is fairly close for the average for the healthcare industry, which is 19.9.
Its P/E ratio suggests that AMN Healthcare Services shareholders think that in the future it will perform about the same as other companies in its industry classification. So if AMN Healthcare Services actually outperforms its peers going forward, that should be a positive for the share price. Checking factors such as director buying and selling. could help you form your own view on if that will happen.
How Growth Rates Impact P/E Ratios
Probably the most important factor in determining what P/E a company trades on is the earnings growth. When earnings grow, the 'E' increases, over time. That means even if the current P/E is high, it will reduce over time if the share price stays flat. So while a stock may look expensive based on past earnings, it could be cheap based on future earnings.
AMN Healthcare Services's earnings per share fell by 13% in the last twelve months. But it has grown its earnings per share by 31% per year over the last five years.
Remember: P/E Ratios Don't Consider The Balance Sheet
It's important to note that the P/E ratio considers the market capitalization, not the enterprise value. Thus, the metric does not reflect cash or debt held by the company. Hypothetically, a company could reduce its future P/E ratio by spending its cash (or taking on debt) to achieve higher earnings.
Such expenditure might be good or bad, in the long term, but the point here is that the balance sheet is not reflected by this ratio.
So What Does AMN Healthcare Services's Balance Sheet Tell Us?
Net debt is 26% of AMN Healthcare Services's market cap. You'd want to be aware of this fact, but it doesn't bother us.
The Verdict On AMN Healthcare Services's P/E Ratio
AMN Healthcare Services has a P/E of 19.9. That's higher than the average in its market, which is 17.3. With a bit of debt, but a lack of recent growth, it's safe to say the market is expecting improved profit performance from the company, in the next few years.
Investors have an opportunity when market expectations about a stock are wrong. As value investor Benjamin Graham famously said, 'In the short run, the market is a voting machine but in the long run, it is a weighing machine.' So this free visual report on analyst forecasts could hold the key to an excellent investment decision.
Of course, you might find a fantastic investment by looking at a few good candidates. So take a peek at this free list of companies with modest (or no) debt, trading on a P/E below 20.
We aim to bring you long-term focused research analysis driven by fundamental data. Note that our analysis may not factor in the latest price-sensitive company announcements or qualitative material.
If you spot an error that warrants correction, please contact the editor at editorial-team@simplywallst.com. This article by Simply Wall St is general in nature. It does not constitute a recommendation to buy or sell any stock, and does not take account of your objectives, or your financial situation. Simply Wall St has no position in the stocks mentioned. Thank you for reading.
