Is Anixter International Inc.'s (NYSE:AXE) 10% ROE Strong Compared To Its Industry?

Want to participate in a short research study? Help shape the future of investing tools and you could win a $250 gift card!
Many investors are still learning about the various metrics that can be useful when analysing a stock. This article is for those who would like to learn about Return On Equity (ROE). To keep the lesson grounded in practicality, we'll use ROE to better understand Anixter International Inc. (NYSE:AXE).
Anixter International has a ROE of 10%, based on the last twelve months. Another way to think of that is that for every $1 worth of equity in the company, it was able to earn $0.10.
See our latest analysis for Anixter International
How Do I Calculate ROE?
The formula for ROE is:
Return on Equity = Net Profit ÷ Shareholders' Equity
Or for Anixter International:
10% = US$163m ÷ US$1.6b (Based on the trailing twelve months to March 2019.)
Most readers would understand what net profit is, but it’s worth explaining the concept of shareholders’ equity. It is the capital paid in by shareholders, plus any retained earnings. Shareholders' equity can be calculated by subtracting the total liabilities of the company from the total assets of the company.
What Does Return On Equity Mean?
Return on Equity measures a company's profitability against the profit it has kept for the business (plus any capital injections). The 'return' is the amount earned after tax over the last twelve months. The higher the ROE, the more profit the company is making. So, all else equal, investors should like a high ROE. Clearly, then, one can use ROE to compare different companies.
Does Anixter International Have A Good Return On Equity?
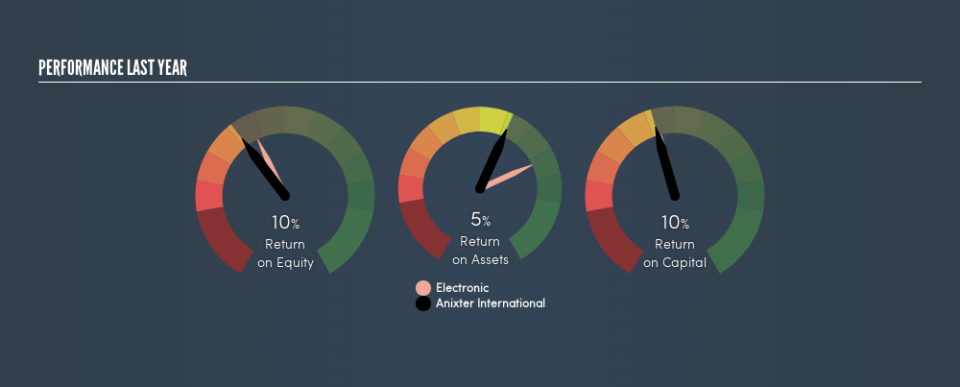
By comparing a company's ROE with its industry average, we can get a quick measure of how good it is. The limitation of this approach is that some companies are quite different from others, even within the same industry classification. The image below shows that Anixter International has an ROE that is roughly in line with the Electronic industry average (12%).
That's not overly surprising. ROE can give us a view about company quality, but many investors also look to other factors, such as whether there are insiders buying shares. If you are like me, then you will not want to miss this free list of growing companies that insiders are buying.
How Does Debt Impact Return On Equity?
Most companies need money -- from somewhere -- to grow their profits. That cash can come from issuing shares, retained earnings, or debt. In the first and second cases, the ROE will reflect this use of cash for investment in the business. In the latter case, the debt used for growth will improve returns, but won't affect the total equity. That will make the ROE look better than if no debt was used.
Combining Anixter International's Debt And Its 10% Return On Equity
Anixter International has a debt to equity ratio of 0.99, which is far from excessive. Although the ROE isn't overly impressive, the debt load is modest, suggesting the business has potential. Conservative use of debt to boost returns is usually a good move for shareholders, though it does leave the company more exposed to interest rate rises.
In Summary
Return on equity is one way we can compare the business quality of different companies. Companies that can achieve high returns on equity without too much debt are generally of good quality. All else being equal, a higher ROE is better.
But when a business is high quality, the market often bids it up to a price that reflects this. Profit growth rates, versus the expectations reflected in the price of the stock, are a particularly important to consider. So you might want to take a peek at this data-rich interactive graph of forecasts for the company.
Of course, you might find a fantastic investment by looking elsewhere. So take a peek at this free list of interesting companies.
We aim to bring you long-term focused research analysis driven by fundamental data. Note that our analysis may not factor in the latest price-sensitive company announcements or qualitative material.
If you spot an error that warrants correction, please contact the editor at editorial-team@simplywallst.com. This article by Simply Wall St is general in nature. It does not constitute a recommendation to buy or sell any stock, and does not take account of your objectives, or your financial situation. Simply Wall St has no position in the stocks mentioned. Thank you for reading.
