Is Apollo Tyres Limited (NSE:APOLLOTYRE) Attractive At This PE Ratio?

This analysis is intended to introduce important early concepts to people who are starting to invest and want to start learning about core concepts of fundamental analysis on practical examples from today’s market.
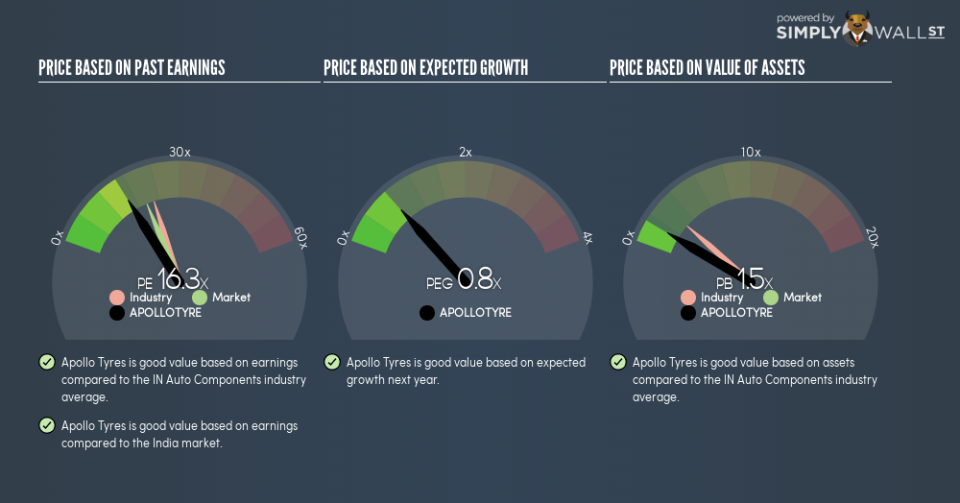
Apollo Tyres Limited (NSE:APOLLOTYRE) trades with a trailing P/E of 16.3x, which is lower than the industry average of 22.5x. While this makes APOLLOTYRE appear like a great stock to buy, you might change your mind after I explain the assumptions behind the P/E ratio. Today, I will break down what the P/E ratio is, how to interpret it and what to watch out for.
Check out our latest analysis for Apollo Tyres
Breaking down the Price-Earnings ratio
P/E is a popular ratio used for relative valuation. It compares a stock’s price per share to the stock’s earnings per share. A more intuitive way of understanding the P/E ratio is to think of it as how much investors are paying for each dollar of the company’s earnings.
P/E Calculation for APOLLOTYRE
Price-Earnings Ratio = Price per share ÷ Earnings per share
APOLLOTYRE Price-Earnings Ratio = ₹260.7 ÷ ₹16.007 = 16.3x
The P/E ratio isn’t a metric you view in isolation and only becomes useful when you compare it against other similar companies. Our goal is to compare the stock’s P/E ratio to the average of companies that have similar attributes to APOLLOTYRE, such as company lifetime and products sold. One way of gathering a peer group is to use firms in the same industry, which is what I’ll do. At 16.3x, APOLLOTYRE’s P/E is lower than its industry peers (22.5x). This implies that investors are undervaluing each dollar of APOLLOTYRE’s earnings. This multiple is a median of profitable companies of 25 Auto Components companies in IN including Ucal Fuel Systems, Ucal Fuel Systems and Enterprises. Therefore, according to this analysis, APOLLOTYRE is an under-priced stock.
A few caveats
While our conclusion might prompt you to buy APOLLOTYRE immediately, there are two important assumptions you should be aware of. Firstly, our peer group contains companies that are similar to APOLLOTYRE. If this isn’t the case, the difference in P/E could be due to other factors. For example, if you are comparing lower risk firms with APOLLOTYRE, then its P/E would naturally be lower than its peers, as investors would value those with lower risk at a higher price. The second assumption that must hold true is that the stocks we are comparing APOLLOTYRE to are fairly valued by the market. If this does not hold, there is a possibility that APOLLOTYRE’s P/E is lower because our peer group is overvalued by the market.
What this means for you:
If your personal research into the stock confirms what the P/E ratio is telling you, it might be a good time to add more of APOLLOTYRE to your portfolio. But keep in mind that the usefulness of relative valuation depends on whether you are comfortable with making the assumptions I mentioned above. Remember that basing your investment decision off one metric alone is certainly not sufficient. There are many things I have not taken into account in this article and the PE ratio is very one-dimensional. If you have not done so already, I urge you to complete your research by taking a look at the following:
Future Outlook: What are well-informed industry analysts predicting for APOLLOTYRE’s future growth? Take a look at our free research report of analyst consensus for APOLLOTYRE’s outlook.
Past Track Record: Has APOLLOTYRE been consistently performing well irrespective of the ups and downs in the market? Go into more detail in the past performance analysis and take a look at the free visual representations of APOLLOTYRE’s historicals for more clarity.
Other High-Performing Stocks: Are there other stocks that provide better prospects with proven track records? Explore our free list of these great stocks here.
To help readers see past the short term volatility of the financial market, we aim to bring you a long-term focused research analysis purely driven by fundamental data. Note that our analysis does not factor in the latest price-sensitive company announcements.
The author is an independent contributor and at the time of publication had no position in the stocks mentioned. For errors that warrant correction please contact the editor at editorial-team@simplywallst.com.
