Applied Materials (AMAT) Q2 Earnings & Sales Beat, Rise Y/Y
Applied Materials Inc. AMAT reported second-quarter fiscal 2021 non-GAAP earnings of $1.63 per share, which surpassed the Zacks Consensus Estimate by 7.9%. Moreover, the bottom line improved 17.3% sequentially and jumped83% year over year.
Net sales of $5.6 billion surpassed the Zacks Consensus Estimate of $5.4 billion. Also, the top line rose 41% from the year-ago period as well as 8.1% from the previous quarter.
Strong performance delivered by all the segments, especially Semiconductor Systems, drove the company’s top line. Increasing demand for silicon in several applications across various markets remained a major tailwind.
Further, the company witnessed a solid momentum in key geographies, namely United States, Europe, Korea, Southeast Asia and China, which remained another positive.
Management believes that the demand for foundry logic is expected to remain strong in the near term, courtesy of the rising need for specialty nodes in automotive, power, 5G rollout, IoT, communications and image sensor markets.
In addition, the company expects DRAM spending to increase in the days ahead.
Applied Materials, Inc. Price, Consensus and EPS Surprise
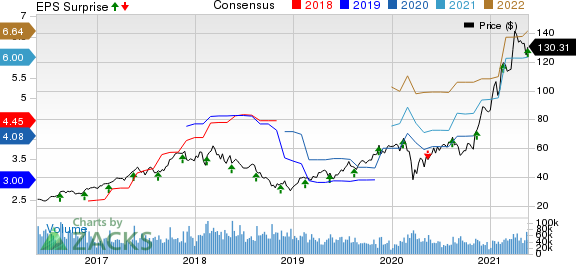
Applied Materials, Inc. price-consensus-eps-surprise-chart | Applied Materials, Inc. Quote
Segments in Detail
Semiconductor Systems generated $3.97 billion in sales (which contributed 71% to its net sales), reflecting a year-over-year increase of 39%. This was driven by growing traction across etch, process control, inspection, metal deposition systems and chemical-mechanical planarization (CMP).
Applied Global Services reported sales of $1.2 billion (22% of net sales), which increased 18% from the prior-year quarter. Strong growth in the services business, owing to solid momentum among long-term service agreements drove the top line for the segment.
Sales from Display and Adjacent Markets were $375 million (7% of net sales), up 3% from the year-ago level. The growing usage of OLED technology in several devices, such as smartphones, especially 5G phones equipped with OLED screens, televisions and notebooks, contributed well.
Revenues by Geography
The United States, Europe, Japan, Korea, Taiwan, Southeast Asia and China generated sales of $489 million, $229 million, $442 million, $1.4 billion, $1.04 billion, $109 million and $1.8 billion, contributing 9%, 4%, 8%, 25%, 19%, 2% and 33% to net sales, respectively.
On a year-over-year basis, sales in United States, Europe, Korea, Taiwan, Southeast Asia and China increased 47.7%, 26.5%, 89.6%, 1.2%, 87.9% and 62%, respectively. Notably, sales in the Japan fell 5.3% from the year-ago quarter, respectively.
Operating Results
Non-GAAP gross margin was 47.7%, expanding 310 basis points (bps) from the year-ago quarter.
Operating expenses were $1.1 billion, up 31.5% from the year-ago quarter. As a percentage of sales, the figure contracted 140 bps year over year to 19.2%.
Non-GAAP operating margin of 31.7% for the reported quarter expanded 700 bps from the prior-year period.
Balance Sheet & Cash Flow
As of May 2, 2020, cash and cash equivalent balance, and short-term investments were $6.8 billion compared with $6.6 billion as of Jan 31, 2020.
Inventories were $4.1 billion in the fiscal second quarter compared with $3.9 billion in the fiscal first quarter. Accounts receivables increased to $3.4 billion in the reported quarter from $3.04 billion in the previous quarter.
Long-term debt was $5.5 billion at the end of the reported quarter compared with $5.4 billion at the end of the previous quarter.
Applied Materials generated a cash flow of $1.2 billion, down from $1.4 billion in the prior quarter.
The company returned $952 million to shareholders out of which it repurchased shares worth $750 million and made dividend payment worth $202 million.
Guidance
For third-quarter fiscal 2021, Applied Materials expects net sales of $5.92 (+/-$200 million). The Zacks Consensus Estimate for the same is pegged at $5.55 billion.
Non-GAAP EPS is expected to be $1.70 to $1.82. The Zacks Consensus Estimate for the same is pegged at $1.57 per share.
Zacks Rank & Other Stocks to Consider
Currently, Applied Materials carries a Zacks Rank #3 (Hold).
Some better-ranked stocks in the broader technology sector are NVIDIA Corporation NVDA, NXP Semiconductors N.V. NXPI and Texas Instruments Incorporated TXN. All companies carry a Zacks Rank #2 (Buy) at present. You can see the complete list of today’s Zacks #1 Rank (Strong Buy) stocks here.
Long-term earnings growth rates of NVIDIA, NXP Semiconductors and Texas Instruments are pegged at 15.23%, 10% and 9.33%, respectively.
More Stock News: This Is Bigger than the iPhone!
It could become the mother of all technological revolutions. Apple sold a mere 1 billion iPhones in 10 years but a new breakthrough is expected to generate more than 77 billion devices by 2025, creating a $1.3 trillion market.
Zacks has just released a Special Report that spotlights this fast-emerging phenomenon and 4 tickers for taking advantage of it. If you don't buy now, you may kick yourself in 2022.
Click here for the 4 trades >>
Want the latest recommendations from Zacks Investment Research? Today, you can download 7 Best Stocks for the Next 30 Days. Click to get this free report
NVIDIA Corporation (NVDA) : Free Stock Analysis Report
Applied Materials, Inc. (AMAT) : Free Stock Analysis Report
Texas Instruments Incorporated (TXN) : Free Stock Analysis Report
NXP Semiconductors N.V. (NXPI) : Free Stock Analysis Report
To read this article on Zacks.com click here.
Zacks Investment Research
