Aquila Services Group plc (LON:AQSG) Is Up But Financials Look Inconsistent: Which Way Is The Stock Headed?
Aquila Services Group's (LON:AQSG) stock up by 8.3% over the past three months. Given that the stock prices usually follow long-term business performance, we wonder if the company's mixed financials could have any adverse effect on its current price price movement In this article, we decided to focus on Aquila Services Group's ROE.
Return on equity or ROE is a key measure used to assess how efficiently a company's management is utilizing the company's capital. In simpler terms, it measures the profitability of a company in relation to shareholder's equity.
See our latest analysis for Aquila Services Group
How To Calculate Return On Equity?
The formula for ROE is:
Return on Equity = Net Profit (from continuing operations) ÷ Shareholders' Equity
So, based on the above formula, the ROE for Aquila Services Group is:
9.2% = UK£576k ÷ UK£6.2m (Based on the trailing twelve months to September 2022).
The 'return' is the profit over the last twelve months. So, this means that for every £1 of its shareholder's investments, the company generates a profit of £0.09.
What Is The Relationship Between ROE And Earnings Growth?
So far, we've learned that ROE is a measure of a company's profitability. Depending on how much of these profits the company reinvests or "retains", and how effectively it does so, we are then able to assess a company’s earnings growth potential. Generally speaking, other things being equal, firms with a high return on equity and profit retention, have a higher growth rate than firms that don’t share these attributes.
Aquila Services Group's Earnings Growth And 9.2% ROE
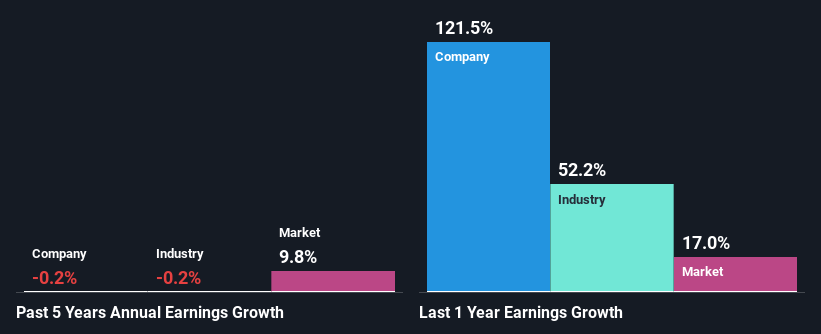
At first glance, Aquila Services Group seems to have a decent ROE. Even so, when compared with the average industry ROE of 17%, we aren't very excited. Further, Aquila Services Group's five year net income growth of -0.2% is more or less flat. Bear in mind, the company does have a respectable level of ROE. It is just that the industry ROE is higher. So there might be other reasons for the flat earnings growth. For example, it could be that the company has a high payout ratio or the business has alloacted capital, for instance.
We then compared Aquila Services Group's performance with the industry and found that the company has shrunk its earnings at a slower rate than the industry earnings which has seen its earnings shrink by 0.2% in the same period. While this is not particularly good, its not particularly bad either.
The basis for attaching value to a company is, to a great extent, tied to its earnings growth. It’s important for an investor to know whether the market has priced in the company's expected earnings growth (or decline). By doing so, they will have an idea if the stock is headed into clear blue waters or if swampy waters await. Is Aquila Services Group fairly valued compared to other companies? These 3 valuation measures might help you decide.
Is Aquila Services Group Making Efficient Use Of Its Profits?
With a high three-year median payout ratio of 69% (implying that the company keeps only 31% of its income) of its business to reinvest into its business), most of Aquila Services Group's profits are being paid to shareholders, which explains the absence of growth in earnings.
In addition, Aquila Services Group has been paying dividends over a period of seven years suggesting that keeping up dividend payments is way more important to the management even if it comes at the cost of business growth.
Summary
On the whole, we feel that the performance shown by Aquila Services Group can be open to many interpretations. On the one hand, the company does have a decent rate of return, however, its earnings growth number is quite disappointing and as discussed earlier, the low retained earnings is hampering the growth. Up till now, we've only made a short study of the company's growth data. To gain further insights into Aquila Services Group's past profit growth, check out this visualization of past earnings, revenue and cash flows.
Have feedback on this article? Concerned about the content? Get in touch with us directly. Alternatively, email editorial-team (at) simplywallst.com.
This article by Simply Wall St is general in nature. We provide commentary based on historical data and analyst forecasts only using an unbiased methodology and our articles are not intended to be financial advice. It does not constitute a recommendation to buy or sell any stock, and does not take account of your objectives, or your financial situation. We aim to bring you long-term focused analysis driven by fundamental data. Note that our analysis may not factor in the latest price-sensitive company announcements or qualitative material. Simply Wall St has no position in any stocks mentioned.
Join A Paid User Research Session
You’ll receive a US$30 Amazon Gift card for 1 hour of your time while helping us build better investing tools for the individual investors like yourself. Sign up here
