How Aramark’s (NYSE:ARMK) Earnings Growth Stacks Up Against The Industry

Investors with a long-term horizong may find it valuable to assess Aramark’s (NYSE:ARMK) earnings trend over time and against its industry benchmark as opposed to simply looking at a sincle earnings announcement at one point in time. Below is my commentary, albiet very simple and high-level, on how Aramark is currently performing.
See our latest analysis for Aramark
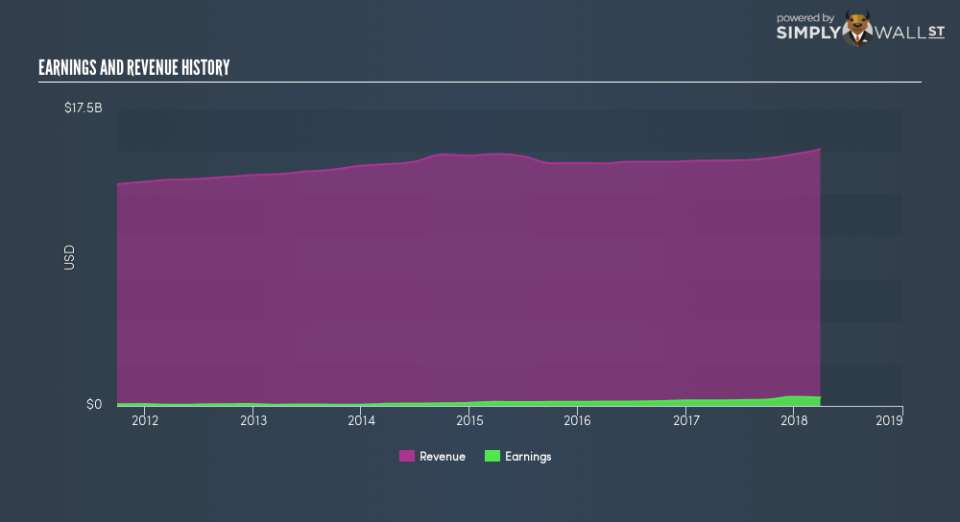
Did ARMK’s recent earnings growth beat the long-term trend and the industry?
ARMK’s trailing twelve-month earnings (from 30 March 2018) of US$498.29m has jumped 54.00% compared to the previous year. Furthermore, this one-year growth rate has exceeded its 5-year annual growth average of 28.98%, indicating the rate at which ARMK is growing has accelerated. How has it been able to do this? Well, let’s take a look at if it is only attributable to an industry uplift, or if Aramark has experienced some company-specific growth.
In the past couple of years, Aramark grew its bottom line faster than revenue by efficiently controlling its costs. This brought about a margin expansion and profitability over time. Viewing growth from a sector-level, the US hospitality industry has been growing its average earnings by double-digit 14.72% in the previous year, and 12.20% over the last five years. This growth is a median of profitable companies of 25 Hospitality companies in US including Golden Entertainment, Melco International Development and Famous Brands. This suggests that any tailwind the industry is enjoying, Aramark is capable of leveraging this to its advantage.
In terms of returns from investment, Aramark has not invested its equity funds well, leading to a 17.77% return on equity (ROE), below the sensible minimum of 20%. Furthermore, its return on assets (ROA) of 5.53% is below the US Hospitality industry of 7.14%, indicating Aramark’s are utilized less efficiently. However, its return on capital (ROC), which also accounts for Aramark’s debt level, has increased over the past 3 years from 4.36% to 4.58%. This correlates with a decrease in debt holding, with debt-to-equity ratio declining from 686.18% to 278.83% over the past 5 years.
What does this mean?
Aramark’s track record can be a valuable insight into its earnings performance, but it certainly doesn’t tell the whole story. Companies that have performed well in the past, such as Aramark gives investors conviction. However, the next step would be to assess whether the future looks as optimistic. I recommend you continue to research Aramark to get a better picture of the stock by looking at:
Future Outlook: What are well-informed industry analysts predicting for ARMK’s future growth? Take a look at our free research report of analyst consensus for ARMK’s outlook.
Financial Health: Is ARMK’s operations financially sustainable? Balance sheets can be hard to analyze, which is why we’ve done it for you. Check out our financial health checks here.
Other High-Performing Stocks: Are there other stocks that provide better prospects with proven track records? Explore our free list of these great stocks here.
NB: Figures in this article are calculated using data from the trailing twelve months from 30 March 2018. This may not be consistent with full year annual report figures.
To help readers see past the short term volatility of the financial market, we aim to bring you a long-term focused research analysis purely driven by fundamental data. Note that our analysis does not factor in the latest price-sensitive company announcements.
The author is an independent contributor and at the time of publication had no position in the stocks mentioned. For errors that warrant correction please contact the editor at editorial-team@simplywallst.com.
