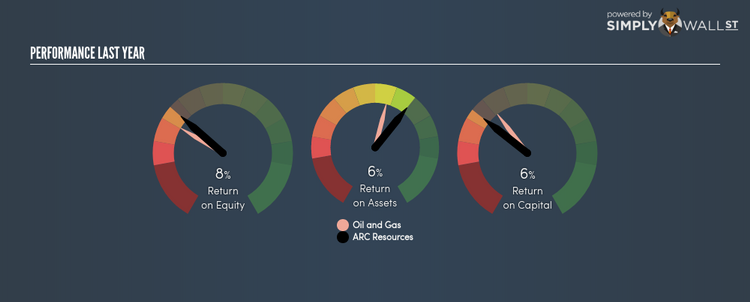
Is ARC Resources Ltd’s (TSE:ARX) 8.21% ROE Strong Compared To Its Industry?

ARC Resources Ltd (TSX:ARX) outperformed the Oil and Gas Exploration and Production industry on the basis of its ROE – producing a higher 8.21% relative to the peer average of 6.50% over the past 12 months. While the impressive ratio tells us that ARX has made significant profits from little equity capital, ROE doesn’t tell us if ARX has borrowed debt to make this happen. Today, we’ll take a closer look at some factors like financial leverage to see how sustainable ARX’s ROE is. View our latest analysis for ARC Resources
What you must know about ROE
Return on Equity (ROE) weighs ARC Resources’s profit against the level of its shareholders’ equity. For example, if the company invests CA$1 in the form of equity, it will generate CA$0.08 in earnings from this. In most cases, a higher ROE is preferred; however, there are many other factors we must consider prior to making any investment decisions.
Return on Equity = Net Profit ÷ Shareholders Equity
ROE is measured against cost of equity in order to determine the efficiency of ARC Resources’s equity capital deployed. Its cost of equity is 11.89%. This means ARC Resources’s returns actually do not cover its own cost of equity, with a discrepancy of -3.68%. This isn’t sustainable as it implies, very simply, that the company pays more for its capital than what it generates in return. ROE can be broken down into three different ratios: net profit margin, asset turnover, and financial leverage. This is called the Dupont Formula:
Dupont Formula
ROE = profit margin × asset turnover × financial leverage
ROE = (annual net profit ÷ sales) × (sales ÷ assets) × (assets ÷ shareholders’ equity)
ROE = annual net profit ÷ shareholders’ equity
The first component is profit margin, which measures how much of sales is retained after the company pays for all its expenses. The other component, asset turnover, illustrates how much revenue ARC Resources can make from its asset base. The most interesting ratio, and reflective of sustainability of its ROE, is financial leverage. Since ROE can be inflated by excessive debt, we need to examine ARC Resources’s debt-to-equity level. Currently the debt-to-equity ratio stands at a low 25.19%, which means its above-average ROE is driven by its ability to grow its profit without a significant debt burden.

Next Steps:
ROE is a simple yet informative ratio, illustrating the various components that each measure the quality of the overall stock. ARC Resources exhibits a strong ROE against its peers, however it was not high enough to cover its own cost of equity this year. Its high ROE is not likely to be driven by high debt. Therefore, investors may have more confidence in the sustainability of this level of returns going forward. Although ROE can be a useful metric, it is only a small part of diligent research.
For ARC Resources, I’ve compiled three important factors you should further examine:
Financial Health: Does it have a healthy balance sheet? Take a look at our free balance sheet analysis with six simple checks on key factors like leverage and risk.
Valuation: What is ARC Resources worth today? Is the stock undervalued, even when its growth outlook is factored into its intrinsic value? The intrinsic value infographic in our free research report helps visualize whether ARC Resources is currently mispriced by the market.
Other High-Growth Alternatives : Are there other high-growth stocks you could be holding instead of ARC Resources? Explore our interactive list of stocks with large growth potential to get an idea of what else is out there you may be missing!
To help readers see pass the short term volatility of the financial market, we aim to bring you a long-term focused research analysis purely driven by fundamental data. Note that our analysis does not factor in the latest price sensitive company announcements.
The author is an independent contributor and at the time of publication had no position in the stocks mentioned.
