This post was originally published on TKer.co
The New York Giants appear to have a supply chain problem.
In a research note to clients Friday, Wells Fargo’s Christopher Harvey flagged a locker-room interview with Giants wide receiver Kenny Golladay from earlier in the week. Behind him was a printout notifying players “DO NOT GIVE YOUR GAME JERSEY AWAY OR SWAP IT… THE UNIFORM COMPANY WHO MAKES OUR JERSEYS CAN NOT MAKE ANYMORE FOR US THIS YEAR.”
It’s a funny anecdote.
It’s also the kind of anecdote that a market prognosticator might reference to support her priors that we are still in the throes of a global supply chain crisis.
However, this is what statisticians might characterize as a type I error, or a false positive.
In reality, most broad supply chain-related metrics (e.g., delivery times, inventories, freight costs, shipping capacity, inflation) suggest this crisis we were facing a year ago has subsided. [For more on this, read: “A bunch of charts showing how supply chains have improved⛓“ and “9 reasons to be optimistic about the economy 💪.]
Yes, there will be plenty of anecdotes suggesting otherwise. But this will always be the case for everything.
We can say the same thing about the high-profile, large-scale layoffs announced at big tech companies over the past year. Last week, Microsoft announced it would cut 10,000 jobs and Google-parent Alphabet announced it would cut 12,000 jobs.
There’s no question these are large numbers, and it’s a very difficult situation for those affected.
But according to Goldman Sachs research, there have been numerous instances when a spike in layoffs in the the tech industry — which represents less than 3% of total employment — did not portend widespread job cuts across the economy. [For more on this, read: “Don't be misled by no-context reports of big tech layoffs 🤨.“]
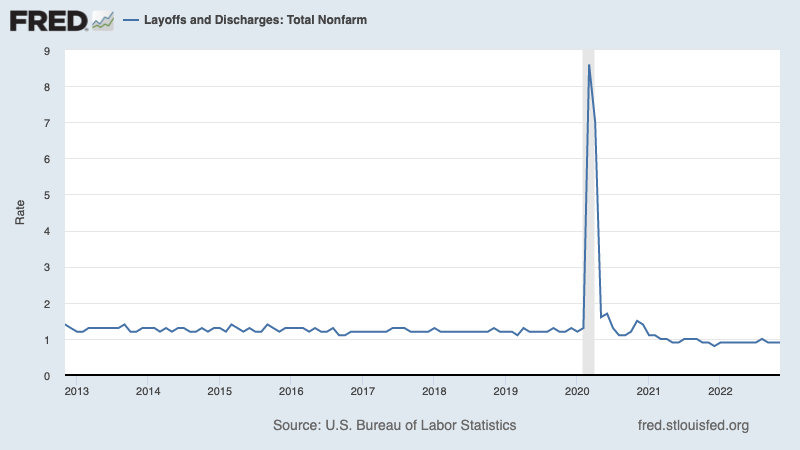
Unfortunately, it’s the case that many companies conduct many layoffs even during periods of economic growth. For almost two years, U.S. employers have laid off between 1.2 million and 1.5 million employees a month. Again, these are large numbers. However, these figures amount to just 0.8% to 1.0% of total employment, which is low by historical standards. Prior to the pandemic, this layoff rate never fell below 1.1%. [For more on this, read: “9 reasons to be optimistic about the economy and markets 💪.”]
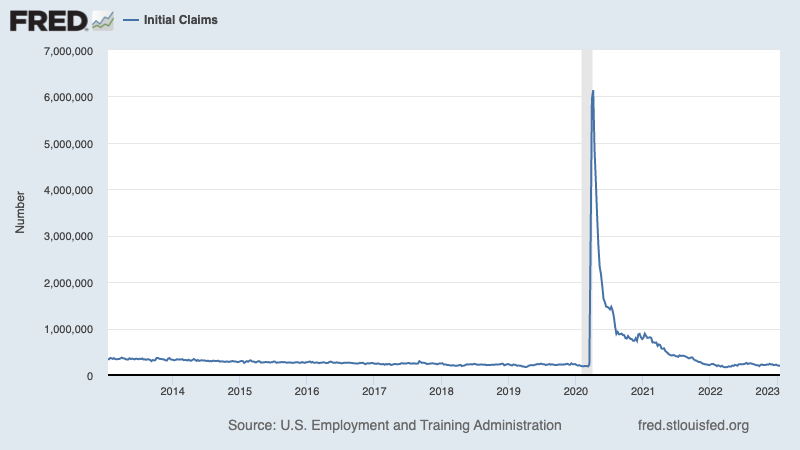
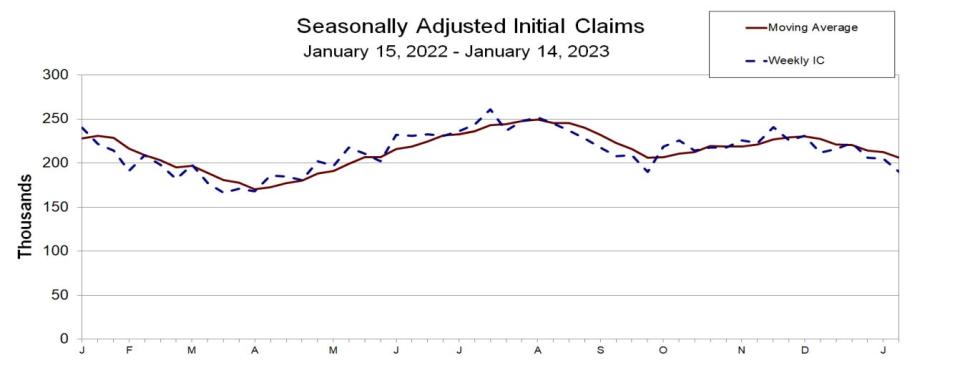
These trends are confirmed by weekly initial claims for unemployment insurance, which are near the lowest levels of the current economic cycle.
The fact that unemployment remains low and job openings have been ticking lower from very high levels suggest many people being laid off are quickly finding work elsewhere.
Vox’s Emily Stewart said it well in an article published Thursday: “If a whisper of a layoff is the thing that goes bump in the night, tons of news stories about thousands of people at Big Important Companies being out of a job feels like the giant monster standing in your door ready to eat you. But all is not as it seems.“
The Atlantic’s Derek Thompson had an article on the topic Friday, noting that among other things tech was in a bubble in recent years. On Saturday, The Wall Street Journal highlighted that from 2019 to 2022, “the employee count at Amazon doubled, Microsoft’s rose 53%, Google parent Alphabet Inc.’s increased 57% and Facebook owner Meta’s ballooned 94%.“
[For more on this, read: “Beware alarming business stories that get a lot of news coverage 🗞️.“]
We certainly can’t rule out the possibility that significant layoffs could come to larger parts of the economy. However, the data suggest the pain is relatively isolated.
Anecdata isn’t totally worthless 🤔
Every couple of weeks, the Federal Reserve publishes its “Beige Book” of economic anecdotes. And it’ll include stuff like:
"A low-cost retailer reported that falling gas prices had driven stronger sales in December, but a high-end retailer exclaimed that 'December is not happening!'"
“Moreover, visits to major tourist attractions, such as the Statue of Liberty, have rebounded to pre-pandemic levels. While attendance at Broadway shows has been mixed, high-profile musicals targeted towards visitors have reportedly fared quite well.“
Anecdotes can be valuable in that they often put a face on the stats we read about every day. Sometimes, they will indeed confirm changes in the economic tides.
However, I’d approach anecdotes with caution. If they’re not confirmed by broader measures or if they conflict with the confluence of available data, then you risk making type I and type II (i.e., a false negative) errors.
So don’t dismiss the anecdata. Just be mindful.
-
Related from TKer:
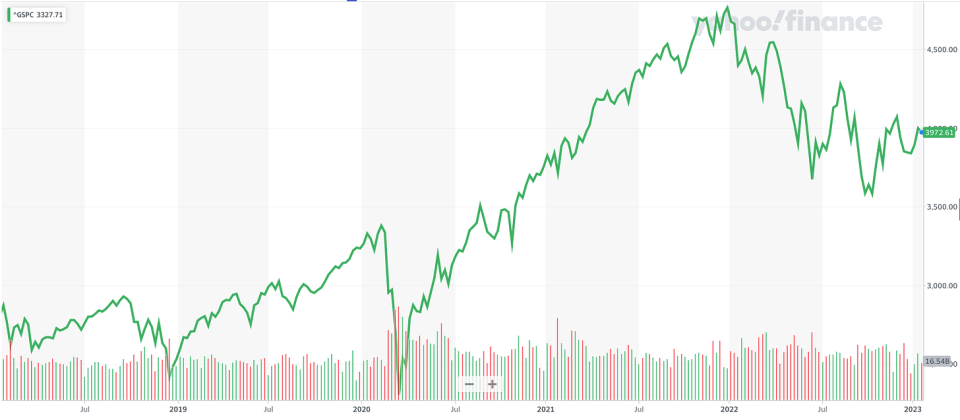
Stocks retreated, with the S&P 500 slipping 0.7% last week. The index is now up 11.1% from its October 12 closing low of 3,577.03 and down 17.2% from its January 3, 2022 closing high of 4,796.56.
Here’s a random stat courtesy of our friends at S&P Dow Jones Indices: “Happy Lunar New Year to those who celebrate! The year of the Rabbit will begin this Sunday (Jan. 22nd), and history may put a hop in investors’ steps in the coming year: based on data since 1931, the year of the Rabbit had the fourth highest average price return for the S&P 500 across the 12 animal signs in the Chinese Zodiac.“

File this one under spurious correlations. That said, it’s kind of fun to think about. Make sure to give grief to your friends and colleagues who were born in a year of the Snake.
-
Related from TKer:
Everyone’s talking about a near-term sell-off. A contrarian signal? 🤔
One of the most frequently cited risks to stocks in 2023 is 'overstated' 😑
Don't expect average returns in the stock market this year 📊
Reviewing the macro crosscurrents 🔀
There were a few notable data points from last week to consider:
📉 Wholesale price inflation is easing. According to the Bureau of Labor Statistics, the producer price index (PPI) in December was up 6.2% from a year ago. Excluding food, energy, and trade, core prices were up 4.6%. On a month-over-month basis, PPI was down 0.5% while core PPI was up 0.1%.

🛍️ Consumer spending is cooling. Retail sales declined by 1.1% in December. Excluding autos and gas, sales were down 0.7%.

A lot of the decline can be explained by lower gasoline prices as gas station sales fell by 4.6%. Still, weakness was broadly based with declines in furniture, electronics and appliances, health and personal care, and restaurants and bars.

🤔 Economists push back on the retail sales report. From BofA’s Michael Gapen: “Statistical distortion exaggerates retail slowdown.“
From JPMorgan’s Daniel Silver: “The December drop in retail sales probably exaggerates any underlying weakness for a few reasons. The data can be noisy from month to month, and there can be big fluctuations in the underlying figures around the holiday season that might be difficult to seasonally adjust for. There also was some harsh winter weather in December that may have weighed on activity. And looking ahead to January, a boost to social security payments associated with the annual cost of living adjustment should be meaningfully lifting incomes (and spending).“
From Renaissance Macro’s Neil Dutta: “…because retail sales are a nominal data point, the drop in consumer prices for durable goods will weigh on the retail sales data. When I deflate retail sales by commodities CPI (it makes no sense to do this with total CPI which includes housing services), I see that sales were flat over the month and up 1.4% annualized over the quarter, the strongest since Q2 2021. This is a reasonably good first pass approximation for real consumption on goods as our figure shows.“
Subscribed
🛠️ Industrial activity. Industrial production activity declined by 0.7% in December, with manufacturing output down 1.3%.

📉 Mortgage rates are coming down. From Freddie Mac: “As inflation continues to moderate, mortgage rates declined again this week. Rates are at their lowest level since September of last year, boosting both homebuyer demand and homebuilder sentiment. Declining rates are providing a much-needed boost to the housing market, but the supply of homes remains a persistent concern.“
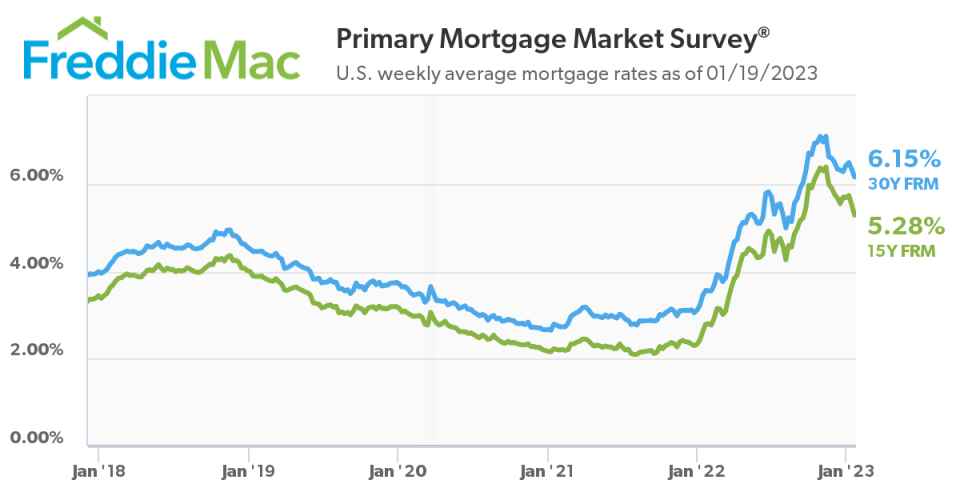
While mortgage rates are still elevated, it’s important to note that 96% of outstanding mortgages have a locked-in rate that’s lower than the current market rate. For more on this, read: “You can make any piece of data look bad if you try 🔄.“

🏚 Home sales are cooling. Sales of previously owned homes declined 1.5% in December to an annualized rate of 4.02 million units. From NAR Chief Economist Lawrence Yun: “December was another difficult month for buyers, who continue to face limited inventory and high mortgage rates. However, expect sales to pick up again soon since mortgage rates have markedly declined after peaking late last year.” For more on this, read: “The U.S. housing market has gone cold 🥶“
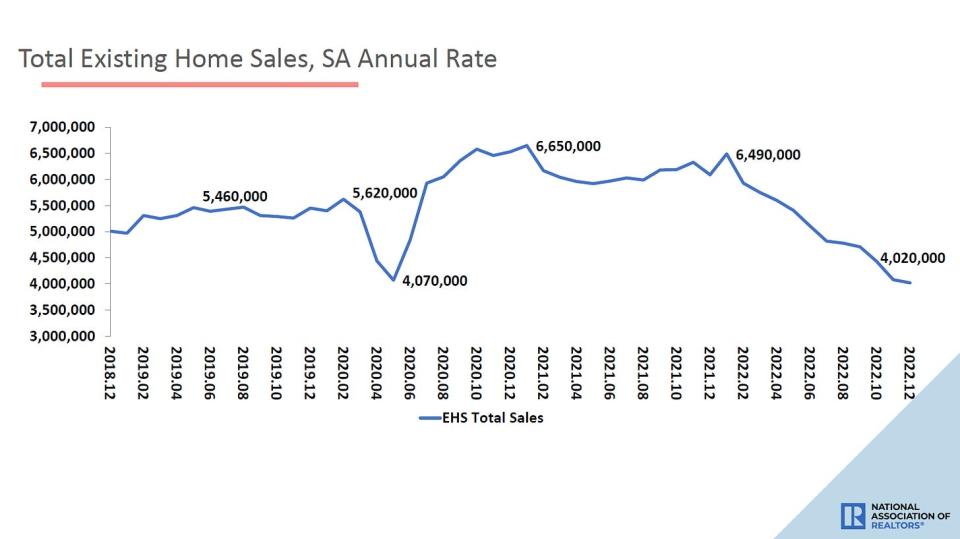
💸 Home prices are cooling. The median home price fell to $366,900 according to the NAR, though it’s up 2.3% from a year ago.

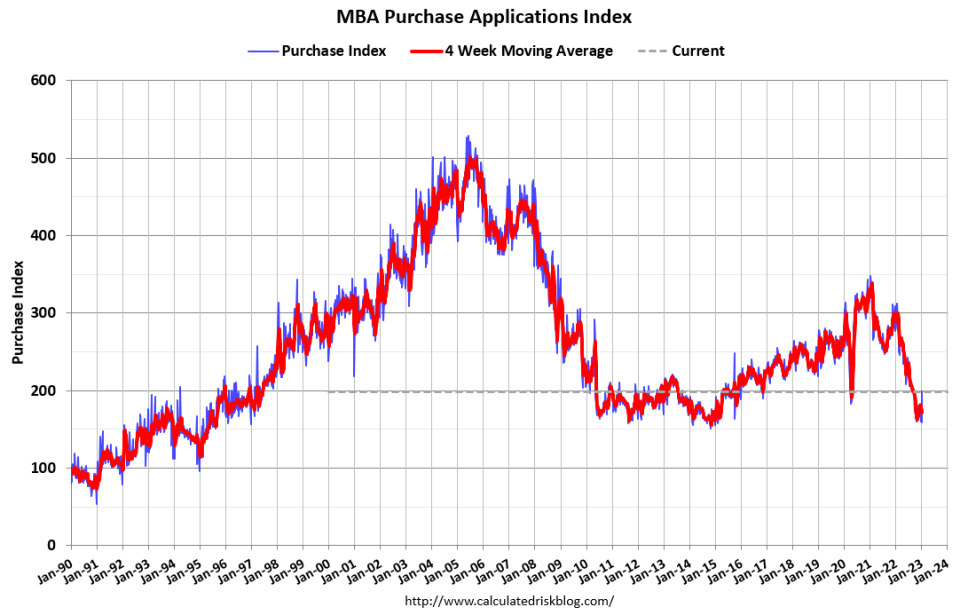
💰 Mortgage applications tick up. From MBA’s Mike Fratanoni: “Mortgage application activity rebounded strongly in the first full week of January, with both refinance and purchase activity increasing by double-digit percentages compared to last week, which included the New Year’s holiday observance. Despite these gains, refinance activity remains more than 80% below last year’s pace and purchase volume remains 35% below year-ago levels.”
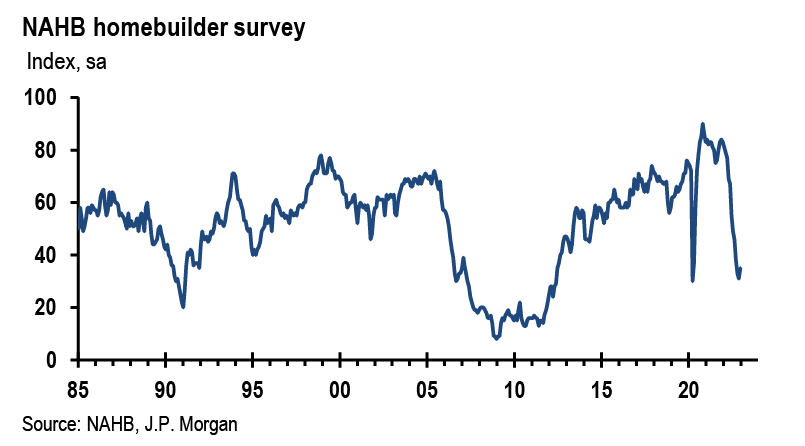
🛠 Builder sentiment gets less bad. The NAHB’s homebuilder sentiment index climbed to 35 in January from 31 in December. From NAHB chairman Jerry Konter: “It appears the low point for builder sentiment in this cycle was registered in December, even as many builders continue to use a variety of incentives, including price reductions, to bolster sales. The rise in builder sentiment also means that cycle lows for permits and starts are likely near, and a rebound for home building could be underway later in 2023.”
💼 Unemployment claims remain low. Initial claims for unemployment benefits fell to 190,000 during the week ending Jan. 14, down from 205,000 the week prior. While the number is up from its six-decade low of 166,000 in March, it remains near levels seen during periods of economic expansion. For more on low unemployment, read: “9 reasons to be optimistic about the economy and markets 💪“
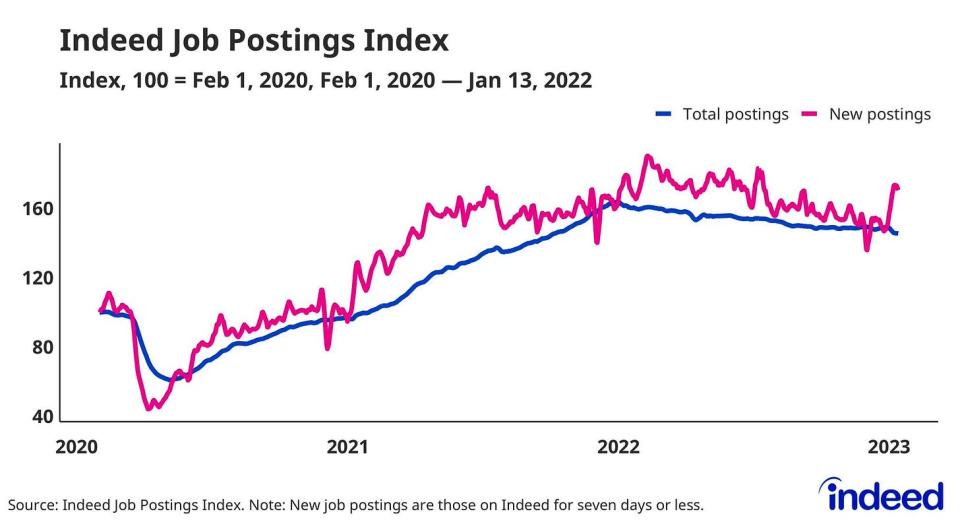
💼 New job postings jump. From Indeed Hiring Lab’s Nick Bunker: “Job postings on Indeed have declined so far this year, down 1.7% month-over-month as of January 13th. But new job postings have jumped, suggesting hiring appetites are stronger than the headline figure suggests.“ For more on job openings, read: “How job openings explain everything in the economy and the markets right now 📋“
🍾 The entrepreneurial spirit is alive. From the Census Bureau: “Total Business Applications in December 2022 were 417,055, down 0.3% (seasonally adjusted) from November 2022.“ Applications continue to trend significantly above pre-pandemic levels.

Putting it all together 🤔
We’re getting a lot of evidence that we may get the bullish “Goldilocks” soft landing scenario where inflation cools to manageable levels without the economy having to sink into recession.
But for now, inflation still has to come down more before the Federal Reserve is comfortable with price levels. So we should expect the central bank to continue to tighten monetary policy, which means tighter financial conditions (e.g. higher interest rates, tighter lending standards, and lower stock valuations). All of this means the market beatings are likely to continue and the risk the economy sinks into a recession will intensify.
However, we could soon see the Fed adopt a less hawkish tone if we continue to get evidence that inflation is easing.
It’s important to remember that while recession risks are elevated, consumers are coming from a very strong financial position. Unemployed people are getting jobs. Those with jobs are getting raises. And many still have excess savings to tap into. Indeed, strong spending data confirms this financial resilience. So it’s too early to sound the alarm from a consumption perspective.
At this point, any downturn is unlikely to turn into economic calamity given that the financial health of consumers and businesses remains very strong.
As always, long-term investors should remember that recessions and bear markets are just part of the deal when you enter the stock market with the aim of generating long-term returns. While markets have had a terrible year, the long-run outlook for stocks remains positive.
For more on how the macro story is evolving, check out the previous TKer macro crosscurrents »
For more on why this is an unusually unfavorable environment for the stock market, read “The market beatings will continue until inflation improves 🥊“ »
For a closer look at where we are and how we got here, read “The complicated mess of the markets and economy, explained 🧩” »
This post was originally published on TKer.co
Sam Ro is the founder of TKer.co. You can follow him on Twitter at @SamRo
Click here for the latest stock market news and in-depth analysis, including events that move stocks
Read the latest financial and business news from Yahoo Finance
Download the Yahoo Finance app for Apple or Android
Follow Yahoo Finance on Twitter, Facebook, Instagram, Flipboard, LinkedIn, and YouTube
