Assura Plc (LSE:AGR) Delivered A Better ROE Than The Industry, Here’s Why

Assura Plc (LSE:AGR) delivered an ROE of 14.50% over the past 12 months, which is an impressive feat relative to its industry average of 11.57% during the same period. Superficially, this looks great since we know that AGR has generated big profits with little equity capital; however, ROE doesn’t tell us how much AGR has borrowed in debt. We’ll take a closer look today at factors like financial leverage to determine whether AGR’s ROE is actually sustainable. Check out our latest analysis for Assura
What you must know about ROE
Return on Equity (ROE) is a measure of AGR’s profit relative to its shareholders’ equity. It essentially shows how much AGR can generate in earnings given the amount of equity it has raised. In most cases, a higher ROE is preferred; however, there are many other factors we must consider prior to making any investment decisions.
Return on Equity = Net Profit ÷ Shareholders Equity
ROE is assessed against cost of equity, which is measured using the Capital Asset Pricing Model (CAPM) – but let’s not dive into the details of that today. For now, let’s just look at the cost of equity number for AGR, which is 8.30%. Since AGR’s return covers its cost in excess of 6.20%, its use of equity capital is efficient and likely to be sustainable. Simply put, AGR pays less for its capital than what it generates in return. ROE can be dissected into three distinct ratios: net profit margin, asset turnover, and financial leverage. This is called the Dupont Formula:
Dupont Formula
ROE = profit margin × asset turnover × financial leverage
ROE = (annual net profit ÷ sales) × (sales ÷ assets) × (assets ÷ shareholders’ equity)
ROE = annual net profit ÷ shareholders’ equity

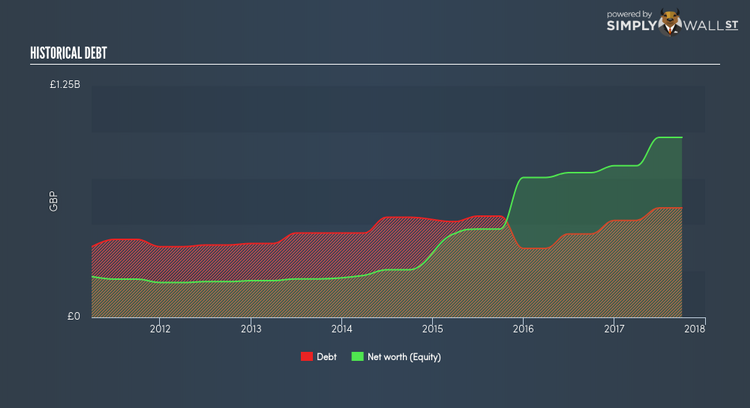
The first component is profit margin, which measures how much of sales is retained after the company pays for all its expenses. Asset turnover reveals how much revenue can be generated from AGR’s asset base. The most interesting ratio, and reflective of sustainability of its ROE, is financial leverage. Since ROE can be inflated by excessive debt, we need to examine AGR’s debt-to-equity level. Currently the debt-to-equity ratio stands at a reasonable 60.85%, which means its above-average ROE is driven by its ability to grow its profit without a significant debt burden.
What this means for you:
Are you a shareholder? AGR’s ROE is impressive relative to the industry average and also covers its cost of equity. Since its high ROE is not likely driven by high debt, it might be a good time to top up on your current holdings if your fundamental research reaffirms this analysis. If you’re looking for new ideas for high-returning stocks, you should take a look at our free platform to see the list of stocks with Return on Equity over 20%.
Are you a potential investor? If AGR has been on your watch list for a while, making an investment decision based on ROE alone is unwise. I recommend you do additional fundamental analysis by looking through our most recent infographic report on Assura to help you make a more informed investment decision.
To help readers see pass the short term volatility of the financial market, we aim to bring you a long-term focused research analysis purely driven by fundamental data. Note that our analysis does not factor in the latest price sensitive company announcements.
The author is an independent contributor and at the time of publication had no position in the stocks mentioned.
