Some Astron (ASX:ATR) Shareholders Have Copped A Big 59% Share Price Drop

Want to participate in a short research study? Help shape the future of investing tools and you could win a $250 gift card!
We think intelligent long term investing is the way to go. But that doesn't mean long term investors can avoid big losses. Zooming in on an example, the Astron Corporation Limited (ASX:ATR) share price dropped 59% in the last half decade. That is extremely sub-optimal, to say the least. Furthermore, it's down 13% in about a quarter. That's not much fun for holders.
See our latest analysis for Astron
Astron isn't currently profitable, so most analysts would look to revenue growth to get an idea of how fast the underlying business is growing. Generally speaking, companies without profits are expected to grow revenue every year, and at a good clip. That's because it's hard to be confident a company will be sustainable if revenue growth is negligible, and it never makes a profit.
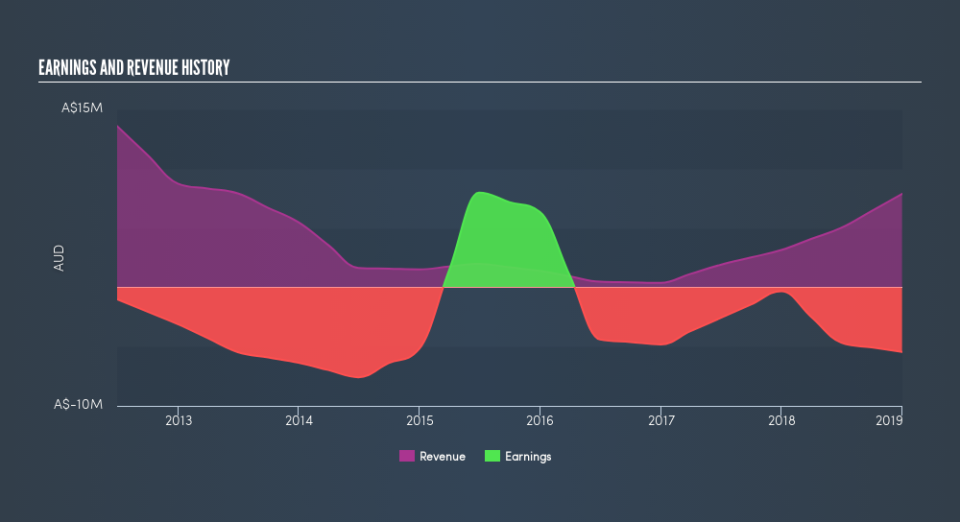
Over five years, Astron grew its revenue at 21% per year. That's well above most other pre-profit companies. In contrast, the share price is has averaged a loss of 16% per year - that's quite disappointing. This could mean high expectations have been tempered, potentially because investors are looking to the bottom line. Given the revenue growth we'd consider the stock to be quite an interesting prospect if the company has a clear path to profitability.
The graphic below shows how revenue and earnings have changed as management guided the business forward. If you want to see cashflow, you can click on the chart.
This free interactive report on Astron's balance sheet strength is a great place to start, if you want to investigate the stock further.
A Different Perspective
Astron shareholders are down 15% for the year, but the market itself is up 11%. However, keep in mind that even the best stocks will sometimes underperform the market over a twelve month period. Unfortunately, longer term shareholders are suffering worse, given the loss of 16% doled out over the last five years. We'd need to see some sustained improvements in the key metrics before we could muster much enthusiasm. Shareholders might want to examine this detailed historical graph of past earnings, revenue and cash flow.
Of course, you might find a fantastic investment by looking elsewhere. So take a peek at this free list of companies we expect will grow earnings.
Please note, the market returns quoted in this article reflect the market weighted average returns of stocks that currently trade on AU exchanges.
We aim to bring you long-term focused research analysis driven by fundamental data. Note that our analysis may not factor in the latest price-sensitive company announcements or qualitative material.
If you spot an error that warrants correction, please contact the editor at editorial-team@simplywallst.com. This article by Simply Wall St is general in nature. It does not constitute a recommendation to buy or sell any stock, and does not take account of your objectives, or your financial situation. Simply Wall St has no position in the stocks mentioned. Thank you for reading.
