ATA Creativity Global (NASDAQ:AACG) shareholders have earned a 17% CAGR over the last five years
Ideally, your overall portfolio should beat the market average. But if you pick the right individual stocks, you could make more -- or less -- than that. The ATA Creativity Global (NASDAQ:AACG) stock price is down 76% over five years, but the total shareholder return is 116% once you include the dividend. And that total return actually beats the market return of 70%. And we doubt long term believers are the only worried holders, since the stock price has declined 65% over the last twelve months. Furthermore, it's down 20% in about a quarter. That's not much fun for holders. However, one could argue that the price has been influenced by the general market, which is down 15% in the same timeframe.
Since shareholders are down over the longer term, lets look at the underlying fundamentals over the that time and see if they've been consistent with returns.
See our latest analysis for ATA Creativity Global
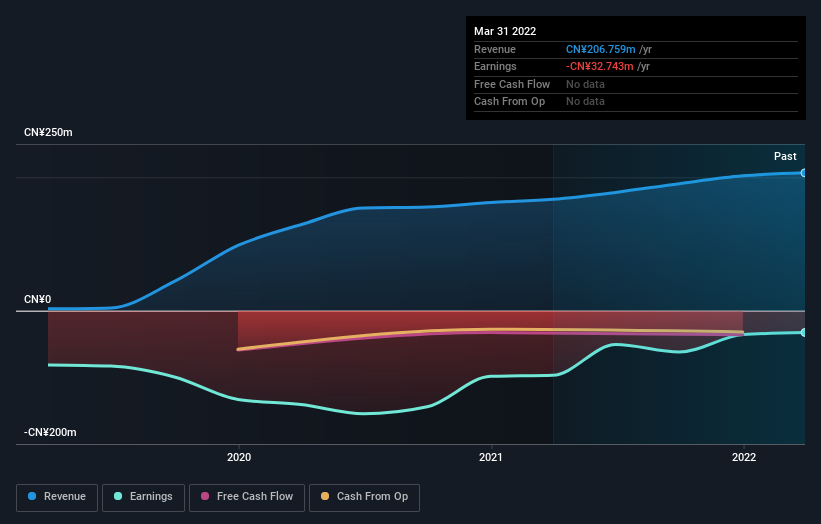
Given that ATA Creativity Global didn't make a profit in the last twelve months, we'll focus on revenue growth to form a quick view of its business development. Shareholders of unprofitable companies usually expect strong revenue growth. That's because it's hard to be confident a company will be sustainable if revenue growth is negligible, and it never makes a profit.
Over half a decade ATA Creativity Global reduced its trailing twelve month revenue by 5.7% for each year. While far from catastrophic that is not good. If a business loses money, you want it to grow, so no surprises that the share price has dropped 12% each year in that time. We're generally averse to companies with declining revenues, but we're not alone in that. Fear of becoming a 'bagholder' may be keeping people away from this stock.
You can see below how earnings and revenue have changed over time (discover the exact values by clicking on the image).
Balance sheet strength is crucial. It might be well worthwhile taking a look at our free report on how its financial position has changed over time.
What about the Total Shareholder Return (TSR)?
We've already covered ATA Creativity Global's share price action, but we should also mention its total shareholder return (TSR). The TSR is a return calculation that accounts for the value of cash dividends (assuming that any dividend received was reinvested) and the calculated value of any discounted capital raisings and spin-offs. Dividends have been really beneficial for ATA Creativity Global shareholders, and that cash payout contributed to why its TSR of 116%, over the last 5 years, is better than the share price return.
A Different Perspective
While the broader market lost about 17% in the twelve months, ATA Creativity Global shareholders did even worse, losing 65%. Having said that, it's inevitable that some stocks will be oversold in a falling market. The key is to keep your eyes on the fundamental developments. Longer term investors wouldn't be so upset, since they would have made 17%, each year, over five years. It could be that the recent sell-off is an opportunity, so it may be worth checking the fundamental data for signs of a long term growth trend. While it is well worth considering the different impacts that market conditions can have on the share price, there are other factors that are even more important. For instance, we've identified 3 warning signs for ATA Creativity Global (1 is significant) that you should be aware of.
If you are like me, then you will not want to miss this free list of growing companies that insiders are buying.
Please note, the market returns quoted in this article reflect the market weighted average returns of stocks that currently trade on US exchanges.
Have feedback on this article? Concerned about the content? Get in touch with us directly. Alternatively, email editorial-team (at) simplywallst.com.
This article by Simply Wall St is general in nature. We provide commentary based on historical data and analyst forecasts only using an unbiased methodology and our articles are not intended to be financial advice. It does not constitute a recommendation to buy or sell any stock, and does not take account of your objectives, or your financial situation. We aim to bring you long-term focused analysis driven by fundamental data. Note that our analysis may not factor in the latest price-sensitive company announcements or qualitative material. Simply Wall St has no position in any stocks mentioned.
