Is Atlantic Union Bankshares Corporation's (NASDAQ:AUB) High P/E Ratio A Problem For Investors?

Today, we'll introduce the concept of the P/E ratio for those who are learning about investing. To keep it practical, we'll show how Atlantic Union Bankshares Corporation's (NASDAQ:AUB) P/E ratio could help you assess the value on offer. Based on the last twelve months, Atlantic Union Bankshares's P/E ratio is 13.53. That corresponds to an earnings yield of approximately 7.4%.
See our latest analysis for Atlantic Union Bankshares
How Do I Calculate A Price To Earnings Ratio?
The formula for price to earnings is:
Price to Earnings Ratio = Price per Share ÷ Earnings per Share (EPS)
Or for Atlantic Union Bankshares:
P/E of 13.53 = USD32.67 ÷ USD2.42 (Based on the trailing twelve months to December 2019.)
Is A High Price-to-Earnings Ratio Good?
A higher P/E ratio means that buyers have to pay a higher price for each USD1 the company has earned over the last year. That isn't necessarily good or bad, but a high P/E implies relatively high expectations of what a company can achieve in the future.
How Does Atlantic Union Bankshares's P/E Ratio Compare To Its Peers?
One good way to get a quick read on what market participants expect of a company is to look at its P/E ratio. You can see in the image below that the average P/E (12.2) for companies in the banks industry is lower than Atlantic Union Bankshares's P/E.
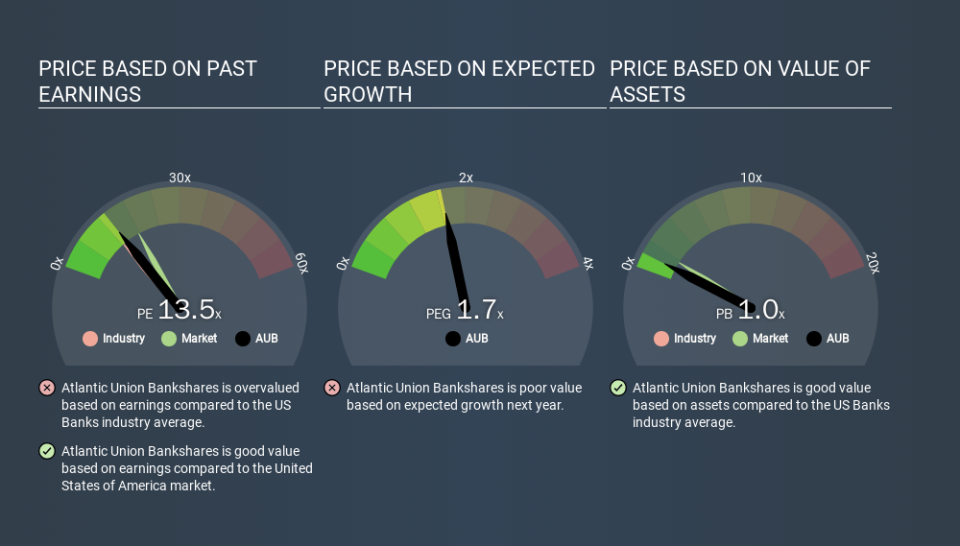
Atlantic Union Bankshares's P/E tells us that market participants think the company will perform better than its industry peers, going forward. Clearly the market expects growth, but it isn't guaranteed. So investors should delve deeper. I like to check if company insiders have been buying or selling.
How Growth Rates Impact P/E Ratios
P/E ratios primarily reflect market expectations around earnings growth rates. If earnings are growing quickly, then the 'E' in the equation will increase faster than it would otherwise. That means even if the current P/E is high, it will reduce over time if the share price stays flat. And as that P/E ratio drops, the company will look cheap, unless its share price increases.
Atlantic Union Bankshares's earnings per share grew by -6.5% in the last twelve months. And its annual EPS growth rate over 5 years is 16%.
Don't Forget: The P/E Does Not Account For Debt or Bank Deposits
It's important to note that the P/E ratio considers the market capitalization, not the enterprise value. That means it doesn't take debt or cash into account. The exact same company would hypothetically deserve a higher P/E ratio if it had a strong balance sheet, than if it had a weak one with lots of debt, because a cashed up company can spend on growth.
While growth expenditure doesn't always pay off, the point is that it is a good option to have; but one that the P/E ratio ignores.
Is Debt Impacting Atlantic Union Bankshares's P/E?
Net debt is 38% of Atlantic Union Bankshares's market cap. You'd want to be aware of this fact, but it doesn't bother us.
The Bottom Line On Atlantic Union Bankshares's P/E Ratio
Atlantic Union Bankshares has a P/E of 13.5. That's below the average in the US market, which is 17.2. EPS grew over the last twelve months, and debt levels are quite reasonable. If growth is sustainable over the long term, then the current P/E ratio may be a sign of good value.
When the market is wrong about a stock, it gives savvy investors an opportunity. As value investor Benjamin Graham famously said, 'In the short run, the market is a voting machine but in the long run, it is a weighing machine. So this free report on the analyst consensus forecasts could help you make a master move on this stock.
But note: Atlantic Union Bankshares may not be the best stock to buy. So take a peek at this free list of interesting companies with strong recent earnings growth (and a P/E ratio below 20).
If you spot an error that warrants correction, please contact the editor at editorial-team@simplywallst.com. This article by Simply Wall St is general in nature. It does not constitute a recommendation to buy or sell any stock, and does not take account of your objectives, or your financial situation. Simply Wall St has no position in the stocks mentioned.
We aim to bring you long-term focused research analysis driven by fundamental data. Note that our analysis may not factor in the latest price-sensitive company announcements or qualitative material. Thank you for reading.
