AUB Group Limited's (ASX:AUB) Financials Are Too Obscure To Link With Current Share Price Momentum: What's In Store For the Stock?

AUB Group (ASX:AUB) has had a great run on the share market with its stock up by a significant 50% over the last three months. However, we wonder if the company's inconsistent financials would have any adverse impact on the current share price momentum. In this article, we decided to focus on AUB Group's ROE.
Return on equity or ROE is a key measure used to assess how efficiently a company's management is utilizing the company's capital. Simply put, it is used to assess the profitability of a company in relation to its equity capital.
View our latest analysis for AUB Group
How Is ROE Calculated?
ROE can be calculated by using the formula:
Return on Equity = Net Profit (from continuing operations) ÷ Shareholders' Equity
So, based on the above formula, the ROE for AUB Group is:
9.3% = AU$44m ÷ AU$475m (Based on the trailing twelve months to December 2019).
The 'return' is the profit over the last twelve months. So, this means that for every A$1 of its shareholder's investments, the company generates a profit of A$0.09.
What Has ROE Got To Do With Earnings Growth?
So far, we've learnt that ROE is a measure of a company's profitability. Based on how much of its profits the company chooses to reinvest or "retain", we are then able to evaluate a company's future ability to generate profits. Assuming everything else remains unchanged, the higher the ROE and profit retention, the higher the growth rate of a company compared to companies that don't necessarily bear these characteristics.
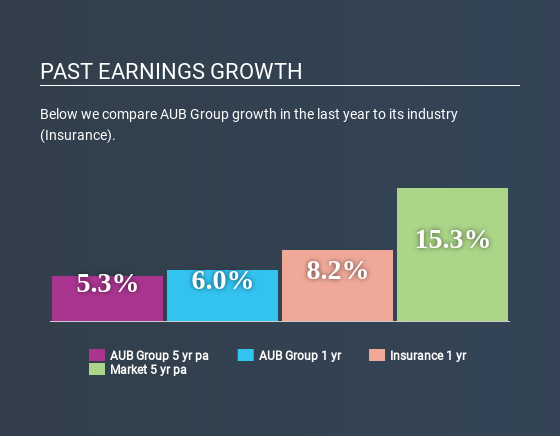
A Side By Side comparison of AUB Group's Earnings Growth And 9.3% ROE
At first glance, AUB Group's ROE doesn't look very promising. Next, when compared to the average industry ROE of 13%, the company's ROE leaves us feeling even less enthusiastic. However, the moderate 5.3% net income growth seen by AUB Group over the past five years is definitely a positive. So, there might be other aspects that are positively influencing the company's earnings growth. For instance, the company has a low payout ratio or is being managed efficiently.
We then compared AUB Group's net income growth with the industry and found that the company's growth figure is lower than the average industry growth rate of 6.8% in the same period, which is a bit concerning.
Earnings growth is a huge factor in stock valuation. What investors need to determine next is if the expected earnings growth, or the lack of it, is already built into the share price. By doing so, they will have an idea if the stock is headed into clear blue waters or if swampy waters await. What is AUB worth today? The intrinsic value infographic in our free research report helps visualize whether AUB is currently mispriced by the market.
Is AUB Group Making Efficient Use Of Its Profits?
While AUB Group has a three-year median payout ratio of 69% (which means it retains 31% of profits), the company has still seen a fair bit of earnings growth in the past, meaning that its high payout ratio hasn't hampered its ability to grow.
Besides, AUB Group has been paying dividends for at least ten years or more. This shows that the company is committed to sharing profits with its shareholders. Upon studying the latest analysts' consensus data, we found that the company is expected to keep paying out approximately 58% of its profits over the next three years. Accordingly, forecasts suggest that AUB Group's future ROE will be 11% which is again, similar to the current ROE.
Conclusion
In total, we're a bit ambivalent about AUB Group's performance. While no doubt its earnings growth is pretty respectable, the low profit retention could mean that the company's earnings growth could have been higher, had it been paying reinvesting a higher portion of its profits. An improvement in its ROE could also help future earnings growth. That being so, the latest analyst forecasts show that the company will continue to see an expansion in its earnings. To know more about the latest analysts predictions for the company, check out this visualization of analyst forecasts for the company.
This article by Simply Wall St is general in nature. It does not constitute a recommendation to buy or sell any stock, and does not take account of your objectives, or your financial situation. We aim to bring you long-term focused analysis driven by fundamental data. Note that our analysis may not factor in the latest price-sensitive company announcements or qualitative material. Simply Wall St has no position in any stocks mentioned.
Have feedback on this article? Concerned about the content? Get in touch with us directly. Alternatively, email editorial-team@simplywallst.com.
