AUD/USD Forex Technical Analysis – Trader Reaction to .6995 Set Today’s Tone
The Australian Dollar is grinding higher on Tuesday in another holiday thinned session. The catalyst behind the move is the news that China’s manufacturing sector managed to stay in expansion territory this month. China’s official Purchasing Managers index was 50.2, a tick above the 50.1 forecast and exactly the same as November’s reading.
At 08:36 GMT, the AUD/USD is trading .7006, up 0.0011 or +0.16%.
Daily Swing Chart Technical Analysis
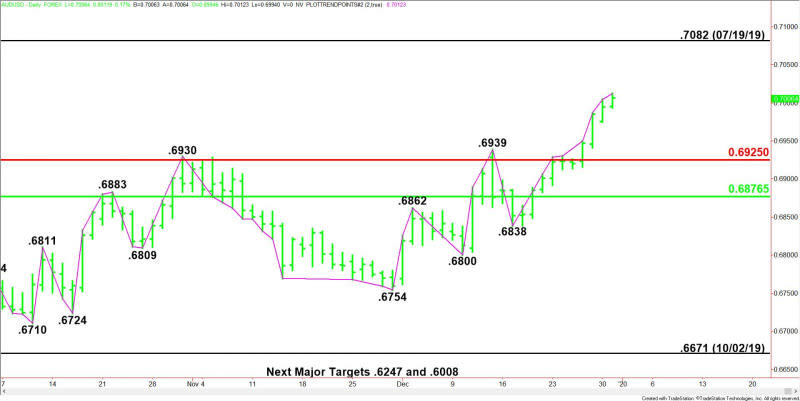
The main trend is up according to the daily swing chart. The uptrend continued when buyers took out yesterday’s high at .7005.
The main trend will change to down when sellers take out the swing bottom at .6838. This is highly unlikely however.
The AUD/USD is currently up ten sessions from the last main bottom at .6838. This puts it in the window of time for a closing price reversal top. This chart pattern won’t change the trend to down, but it will indicate the selling is greater than the buying at current price levels. If confirmed, this could trigger the start of a 2 to 3 day break or a 50% correction of the rally from .6838.
The main range is .7082 to .6671. Its retracement zone at .6925 to .6876 is controlling the near-term direction of the Forex pair. It’s all the main support.
Daily Swing Chart Technical Forecast
Given the prolonged move up, the direction of the AUD/USD the rest of the session on Tuesday is likely to be determined by trader reaction to Monday’s close at .6995.
Bullish Scenario
A sustained move over .6995 will indicate the presence of buyers. If the upside momentum continues over the near-term then look for a rally into its July 19 top at .7082.
Bearish Scenario
A sustained move under .6995 will signal the return of sellers. This will put the AUD/USD in a position to post a potentially bearish closing price reversal top.
If formed and confirmed, this chart pattern could trigger a 2 to 3 day break. It won’t change the trend to down, however. It could lead to a pullback into the main Fibonacci level at .6925.
Since the main trend is up, buyers are likely to come in on a pullback into the support zone.
This article was originally posted on FX Empire
