AUD/USD Forex Technical Analysis – April 17, 2018 Forecast
The Australian Dollar is trading slightly lower against the U.S. Dollar on Tuesday. The price action is being influenced by several factors including the Reserve Bank of Australia meeting minutes, China economic reports, increasing demand for higher risk assets and rising U.S. Treasury yields.
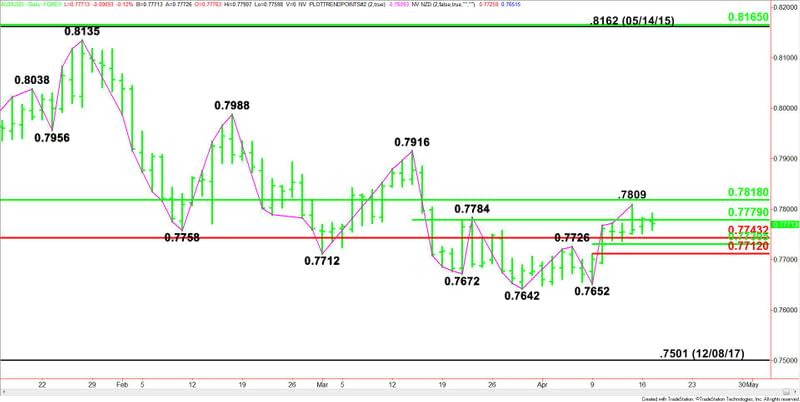
At 1122 GMT, the AUD/USD is trading .7772, down 0.0009 or -0.11%.
Daily Swing Chart Technical Analysis
The main trend is up according to the daily swing chart. A trade through .7809 will signal a resumption of the uptrend. A move through .7652 will change the main trend to down.
The minor trend is down. A trade through .7735 will change the minor trend to down.
The AUD/USD is currently trading inside a major retracement zone, bounded by .7818 and .7743.
The main range is .7916 to .7642. Its 50% level or pivot comes in at .7779. The AUD/USD has straddled this level the last three days.
The minor range is .7652 to .7809. Its retracement zone at .7730 to .7712 is the primary downside target.
Daily Swing Chart Technical Forecast
Based on the early price action, the direction of the AUD/USD the rest of the session is likely to be determined by trader reaction to the 50% level at .7779.
A sustained move under .7779 will indicate the presence of sellers. This could drive the Aussie into levels at .7743, .7730 and .7712. The latter is the trigger point for an acceleration to the downside.
A sustained move over .7779 will signal the presence of buyers. This move could generate the upside momentum needed to challenge .7809 then .7818. The trigger point for an acceleration to the upside is the main 50% level at .7818.
This article was originally posted on FX Empire
More From FXEMPIRE:
E-mini Dow Jones Industrial Average (YM) Futures Analysis – April 17, 2018 Forecast
E-mini NASDAQ-100 Index (NQ) Futures Technical Analysis – April 17, 2018 Forecast
If History Repeats Itself – The Next Financial Crisis is Around the Corner
Technical Outlook of EUR/USD, GBP/USD, NZD/USD & USD/CHF: 17.04.2018
