AUD/USD Technical Analysis 05.09.2013
AUD/USD Technical Analysis– Prices are staging a recovery from multi-month range support in the 1.0163-81 area, a barrier reinforced by the 61.8% Fibonacci expansion at 1.0161. Overall positioning shows a Falling Wedge chart pattern, a setup hinting at a reversal higher may be brewing. Buyers are now testing the 38.2% level at 1.0246, with a break above that targeting the Wedge top at 1.0294.
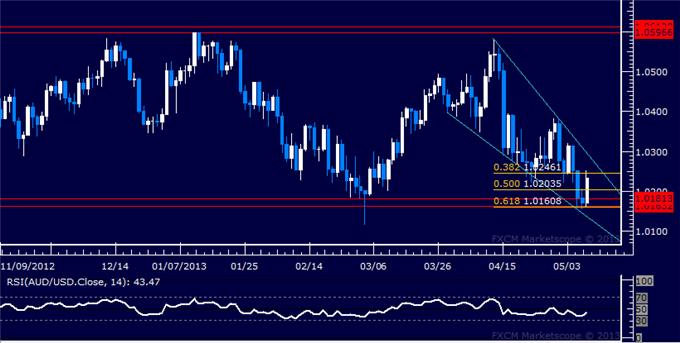
Daily Chart - Created Using FXCM Marketscope 2.0
--- Written by Ilya Spivak, Currency Strategist for Dailyfx.com
To contact Ilya, e-mail ispivak@dailyfx.com. Follow Ilya on Twitter at @IlyaSpivak
To be added to Ilya's e-mail distribution list, please CLICK HERE
New to FX? Watch this Video. For live market updates, visit the Real Time News Feed
DailyFX provides forex news and technical analysis on the trends that influence the global currency markets.
Learn forex trading with a free practice account and trading charts from FXCM.
