Is Barrett Business Services, Inc. (NASDAQ:BBSI) Struggling With Its 8.6% Return On Capital Employed?

Today we are going to look at Barrett Business Services, Inc. (NASDAQ:BBSI) to see whether it might be an attractive investment prospect. Specifically, we're going to calculate its Return On Capital Employed (ROCE), in the hopes of getting some insight into the business.
First, we'll go over how we calculate ROCE. Next, we'll compare it to others in its industry. Last but not least, we'll look at what impact its current liabilities have on its ROCE.
What is Return On Capital Employed (ROCE)?
ROCE measures the 'return' (pre-tax profit) a company generates from capital employed in its business. Generally speaking a higher ROCE is better. Ultimately, it is a useful but imperfect metric. Renowned investment researcher Michael Mauboussin has suggested that a high ROCE can indicate that 'one dollar invested in the company generates value of more than one dollar'.
How Do You Calculate Return On Capital Employed?
The formula for calculating the return on capital employed is:
Return on Capital Employed = Earnings Before Interest and Tax (EBIT) ÷ (Total Assets - Current Liabilities)
Or for Barrett Business Services:
0.086 = US$37m ÷ (US$756m - US$327m) (Based on the trailing twelve months to December 2018.)
So, Barrett Business Services has an ROCE of 8.6%.
See our latest analysis for Barrett Business Services
Is Barrett Business Services's ROCE Good?
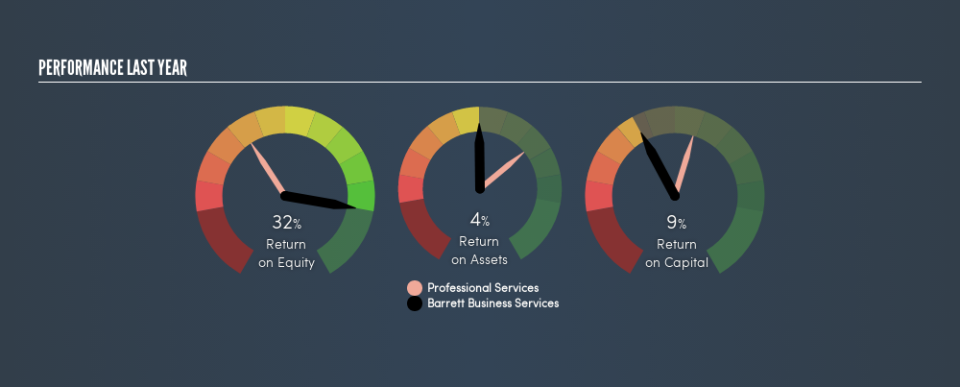
ROCE is commonly used for comparing the performance of similar businesses. Using our data, Barrett Business Services's ROCE appears to be significantly below the 12% average in the Professional Services industry. This performance could be negative if sustained, as it suggests the business may underperform its industry. Aside from the industry comparison, Barrett Business Services's ROCE is mediocre in absolute terms, considering the risk of investing in stocks versus the safety of a bank account. Investors may wish to consider higher-performing investments.
Barrett Business Services's current ROCE of 8.6% is lower than 3 years ago, when the company reported a 14% ROCE. Therefore we wonder if the company is facing new headwinds.
When considering this metric, keep in mind that it is backwards looking, and not necessarily predictive. ROCE can be misleading for companies in cyclical industries, with returns looking impressive during the boom times, but very weak during the busts. ROCE is, after all, simply a snap shot of a single year. Since the future is so important for investors, you should check out our free report on analyst forecasts for Barrett Business Services.
What Are Current Liabilities, And How Do They Affect Barrett Business Services's ROCE?
Current liabilities include invoices, such as supplier payments, short-term debt, or a tax bill, that need to be paid within 12 months. Due to the way ROCE is calculated, a high level of current liabilities makes a company look as though it has less capital employed, and thus can (sometimes unfairly) boost the ROCE. To check the impact of this, we calculate if a company has high current liabilities relative to its total assets.
Barrett Business Services has total assets of US$756m and current liabilities of US$327m. As a result, its current liabilities are equal to approximately 43% of its total assets. Barrett Business Services has a medium level of current liabilities, which would boost its ROCE somewhat.
The Bottom Line On Barrett Business Services's ROCE
Despite this, its ROCE is still mediocre, and you may find more appealing investments elsewhere. Of course, you might also be able to find a better stock than Barrett Business Services. So you may wish to see this free collection of other companies that have grown earnings strongly.
If you are like me, then you will not want to miss this free list of growing companies that insiders are buying.
We aim to bring you long-term focused research analysis driven by fundamental data. Note that our analysis may not factor in the latest price-sensitive company announcements or qualitative material.
If you spot an error that warrants correction, please contact the editor at editorial-team@simplywallst.com. This article by Simply Wall St is general in nature. It does not constitute a recommendation to buy or sell any stock, and does not take account of your objectives, or your financial situation. Simply Wall St has no position in the stocks mentioned. Thank you for reading.
