Based On Its ROE, Is Jerash Holdings (US), Inc. (NASDAQ:JRSH) A High Quality Stock?

Want to participate in a short research study? Help shape the future of investing tools and receive a $20 prize!
While some investors are already well versed in financial metrics (hat tip), this article is for those who would like to learn about Return On Equity (ROE) and why it is important. We’ll use ROE to examine Jerash Holdings (US), Inc. (NASDAQ:JRSH), by way of a worked example.
Jerash Holdings (US) has a ROE of 8.5%, based on the last twelve months. That means that for every $1 worth of shareholders’ equity, it generated $0.085 in profit.
Check out our latest analysis for Jerash Holdings (US)
How Do You Calculate ROE?
The formula for ROE is:
Return on Equity = Net Profit ÷ Shareholders’ Equity
Or for Jerash Holdings (US):
8.5% = 4.347061 ÷ US$51m (Based on the trailing twelve months to December 2018.)
It’s easy to understand the ‘net profit’ part of that equation, but ‘shareholders’ equity’ requires further explanation. It is all earnings retained by the company, plus any capital paid in by shareholders. The easiest way to calculate shareholders’ equity is to subtract the company’s total liabilities from the total assets.
What Does ROE Signify?
ROE measures a company’s profitability against the profit it retains, and any outside investments. The ‘return’ is the amount earned after tax over the last twelve months. That means that the higher the ROE, the more profitable the company is. So, all else being equal, a high ROE is better than a low one. That means ROE can be used to compare two businesses.
Does Jerash Holdings (US) Have A Good Return On Equity?
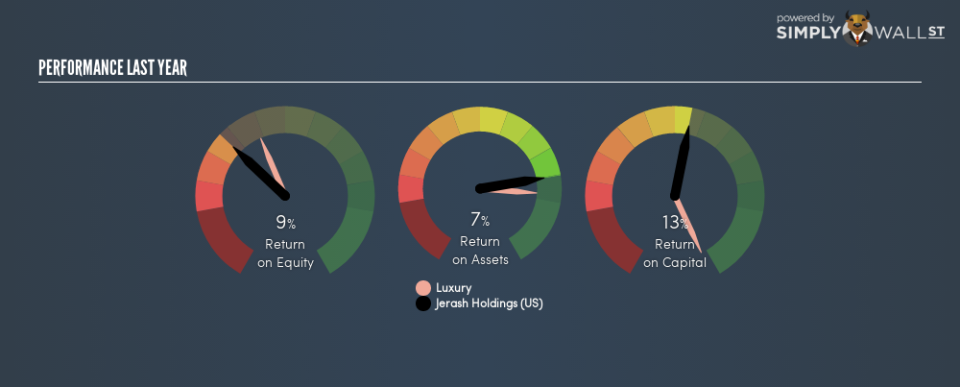
Arguably the easiest way to assess company’s ROE is to compare it with the average in its industry. Importantly, this is far from a perfect measure, because companies differ significantly within the same industry classification. If you look at the image below, you can see Jerash Holdings (US) has a lower ROE than the average (12%) in the Luxury industry classification.
That’s not what we like to see. We’d prefer see an ROE above the industry average, but it might not matter if the company is undervalued. Nonetheless, it might be wise to check if insiders have been selling.
How Does Debt Impact Return On Equity?
Most companies need money — from somewhere — to grow their profits. That cash can come from retained earnings, issuing new shares (equity), or debt. In the case of the first and second options, the ROE will reflect this use of cash, for growth. In the latter case, the use of debt will improve the returns, but will not change the equity. That will make the ROE look better than if no debt was used.
Combining Jerash Holdings (US)’s Debt And Its 8.5% Return On Equity
While Jerash Holdings (US) does have a tiny amount of debt, with debt to equity of just 0.00041, we think the use of debt is very modest. Although the ROE isn’t overly impressive, the debt load is modest, suggesting the business has potential. Judicious use of debt to improve returns can certainly be a good thing, although it does elevate risk slightly and reduce future optionality.
But It’s Just One Metric
Return on equity is one way we can compare the business quality of different companies. Companies that can achieve high returns on equity without too much debt are generally of good quality. If two companies have around the same level of debt to equity, and one has a higher ROE, I’d generally prefer the one with higher ROE.
But when a business is high quality, the market often bids it up to a price that reflects this. Profit growth rates, versus the expectations reflected in the price of the stock, are a particularly important to consider. So you might want to check this FREE visualization of analyst forecasts for the company.
If you would prefer check out another company — one with potentially superior financials — then do not miss this free list of interesting companies, that have HIGH return on equity and low debt.
We aim to bring you long-term focused research analysis driven by fundamental data. Note that our analysis may not factor in the latest price-sensitive company announcements or qualitative material.
If you spot an error that warrants correction, please contact the editor at editorial-team@simplywallst.com. This article by Simply Wall St is general in nature. It does not constitute a recommendation to buy or sell any stock, and does not take account of your objectives, or your financial situation. Simply Wall St has no position in the stocks mentioned. On rare occasion, data errors may occur. Thank you for reading.
