Should BCE Inc’s (TSE:BCE) Recent Earnings Worry You?

Assessing BCE Inc’s (TSE:BCE) past track record of performance is an insightful exercise for investors. It allows us to reflect on whether or not the company has met or exceed expectations, which is a great indicator for future performance. Today I will assess BCE’s recent performance announced on 31 March 2018 and evaluate these figures to its long-term trend and industry movements. Check out our latest analysis for BCE
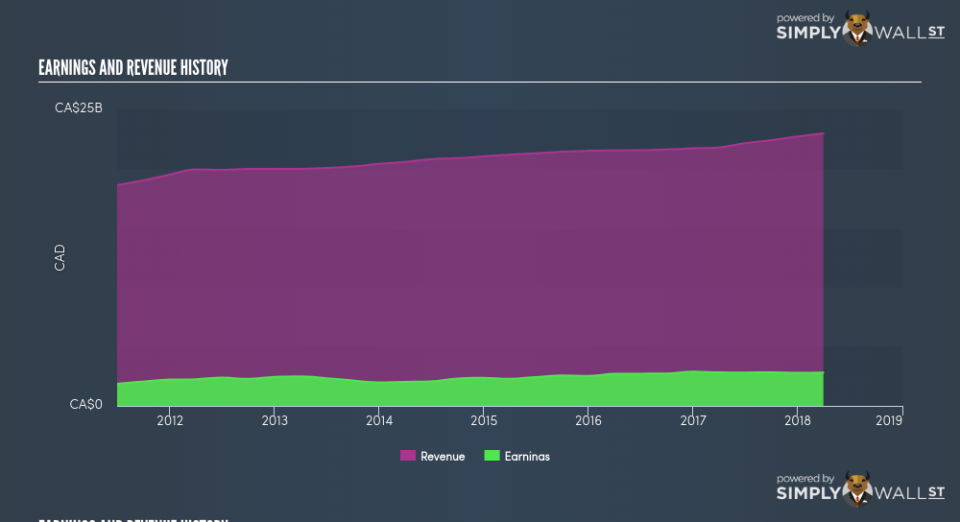
Commentary On BCE’s Past Performance
BCE’s trailing twelve-month earnings (from 31 March 2018) of CA$2.81b has declined by -0.85% compared to the previous year. Furthermore, this one-year growth rate has been lower than its average earnings growth rate over the past 5 years of 4.95%, indicating the rate at which BCE is growing has slowed down. What could be happening here? Let’s examine what’s going on with margins and whether the entire industry is experiencing the hit as well.
Over the last few years, revenue growth has failed to keep up which implies that BCE’s bottom line has been driven by unsustainable cost-reductions. Scanning growth from a sector-level, the Canadian telecom industry has been growing, albeit, at a unexciting single-digit rate of 6.50% over the previous twelve months, and 3.87% over the past five years. This suggests that any tailwind the industry is deriving benefit from, BCE has not been able to leverage it as much as its average peer.
In terms of returns from investment, BCE has not invested its equity funds well, leading to a 14.74% return on equity (ROE), below the sensible minimum of 20%. However, its return on assets (ROA) of 6.65% exceeds the CA Telecom industry of 5.06%, indicating BCE has used its assets more efficiently. Though, its return on capital (ROC), which also accounts for BCE’s debt level, has declined over the past 3 years from 10.85% to 9.25%. This correlates with an increase in debt holding, with debt-to-equity ratio rising from 113.01% to 122.52% over the past 5 years.
What does this mean?
BCE’s track record can be a valuable insight into its earnings performance, but it certainly doesn’t tell the whole story. Companies that are profitable, but have volatile earnings, can have many factors influencing its business. I recommend you continue to research BCE to get a better picture of the stock by looking at:
Future Outlook: What are well-informed industry analysts predicting for BCE’s future growth? Take a look at our free research report of analyst consensus for BCE’s outlook.
Financial Health: Is BCE’s operations financially sustainable? Balance sheets can be hard to analyze, which is why we’ve done it for you. Check out our financial health checks here.
Other High-Performing Stocks: Are there other stocks that provide better prospects with proven track records? Explore our free list of these great stocks here.
NB: Figures in this article are calculated using data from the trailing twelve months from 31 March 2018. This may not be consistent with full year annual report figures.
To help readers see pass the short term volatility of the financial market, we aim to bring you a long-term focused research analysis purely driven by fundamental data. Note that our analysis does not factor in the latest price sensitive company announcements.
The author is an independent contributor and at the time of publication had no position in the stocks mentioned.
