New Year Begins with an Exponential Rise in Gold’s Bullish Sentiment
Although the factors that moved gold pricing just over $50 on the first trading day in 2021 have been in existence for quite some time. However, real concern regarding the eradication of the coronavirus through vaccinations and the timeline that would take, coupled with the enormous capital that the U.S. Treasury has already allocated for fiscal stimulus has become the primary focus of traders and market participants.
This can be easily expressed in today’s activity in the financial markets with US equities under tremendous pressure. Given that the Dow Jones recovered off of its lows it still lost 382 points in trading today which is a 1.25% decline. Similarly, the NASDAQ composite gave up 1.47%, and the S&P 500 lost 1.49%.
This type of strong bearish sentiment and selling in U.S. equities underscores the real concern market participants have that the economic recovery could take much longer than many had anticipated, and when coupled with the economic fallout from the massive expenditures by the U.S. Treasury and the extremely accommodative monetary policy of the Federal Reserve are the necessary components for a perfect storm scenario which could take gold and silver dramatically higher from current pricing.
Although the U.S. dollar closed, in essence, unchanged it is currently fixed below 90 at 89.87 after today’s decline of 0.03%, market participants were active buyers in both gold and silver today taking both precious metals substantially higher. As of 5 PM EST gold futures bases, the most active February contract is currently up by $51.60 (+2.72%) and fixed at $1946.70. Silver also had a stellar performance today gaining $0.97 per ounce or 3.68%, taking the precious white metal to $27.385.

A technical basis market action today provided traders with confirmation that the bullish trend is not only intact but has the energy to sustain prices moving to a higher level. The first significant observation is that gold prices opened just above their 100-day moving average which is currently fixed at $1901.70
Secondly, gold prices broke through and closed above a key resistance area based upon Fibonacci retracement. The data set used for this retracement begins in the middle of March when gold bottomed at $1450 and concludes during the first week of August when gold reached its all-time record high at $2088. The 23.6% Fibonacci retracement is currently fixed at $1937.90, and gold close well above it currently fixed at $1946.70.
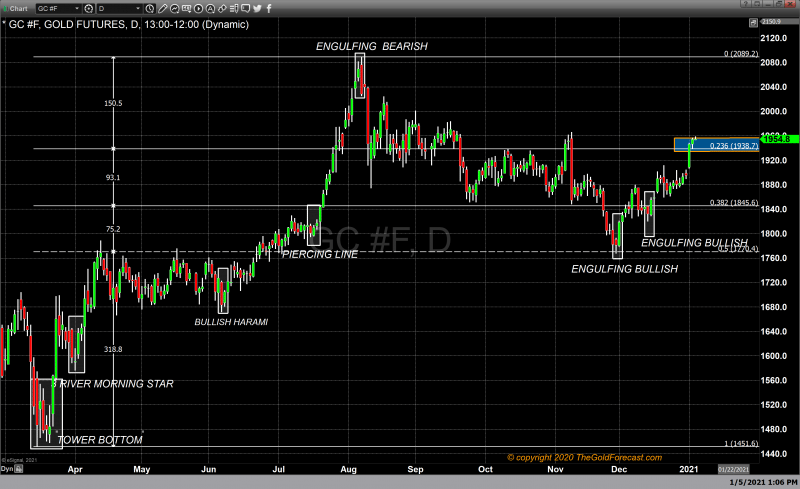
The 23.6% Fibonacci retracement is the final retracement level between current pricing and the all-time record high. This means that we have minor resistance levels that are based upon recent price tops that were not sustainable. The first level of minor resistance occurs at $1961 which was the high achieved during the second week of November. The next level of minor resistance occurred mid-August when gold pricing was at approximately $2023 per ounce. With absolute major resistance found at $2088, the all-time record high occurred the first week of August.
Today’s dramatic rise in both gold and silver pricing represents the real potential for the current rally to gain momentum and to quickly move to the next level of potential resistance. The chart included in this article details the four primary levels where gold could find resistance that is based on recent tops in gold pricing.
For more information on our service simply use this link.
Wishing you as always, good trading and good health,
Gary S. Wagner
For a look at all of today’s economic events, check out our economic calendar.
This article was originally posted on FX Empire
