What is Behind Cenovus Energy Inc’s (TSE:CVE) Superior ROE?

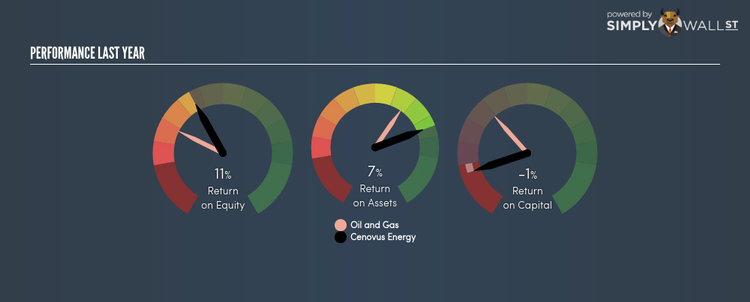
With an ROE of 11.35%, Cenovus Energy Inc (TSX:CVE) outpaced its own industry which delivered a less exciting 5.96% over the past year. On the surface, this looks fantastic since we know that CVE has made large profits from little equity capital; however, ROE doesn’t tell us if management have borrowed heavily to make this happen. In this article, we’ll closely examine some factors like financial leverage to evaluate the sustainability of CVE’s ROE. Check out our latest analysis for Cenovus Energy
Breaking down ROE — the mother of all ratios
Firstly, Return on Equity, or ROE, is simply the percentage of last years’ earning against the book value of shareholders’ equity. It essentially shows how much the company can generate in earnings given the amount of equity it has raised. Generally speaking, a higher ROE is preferred; however, there are other factors we must also consider before making any conclusions.
Return on Equity = Net Profit ÷ Shareholders Equity
Returns are usually compared to costs to measure the efficiency of capital. Cenovus Energy’s cost of equity is 14.71%. Since Cenovus Energy’s return does not cover its cost, with a difference of -3.36%, this means its current use of equity is not efficient and not sustainable. Very simply, Cenovus Energy pays more for its capital than what it generates in return. ROE can be dissected into three distinct ratios: net profit margin, asset turnover, and financial leverage. This is called the Dupont Formula:
Dupont Formula
ROE = profit margin × asset turnover × financial leverage
ROE = (annual net profit ÷ sales) × (sales ÷ assets) × (assets ÷ shareholders’ equity)
ROE = annual net profit ÷ shareholders’ equity
The first component is profit margin, which measures how much of sales is retained after the company pays for all its expenses. The other component, asset turnover, illustrates how much revenue Cenovus Energy can make from its asset base. Finally, financial leverage will be our main focus today. It shows how much of assets are funded by equity and can show how sustainable the company’s capital structure is. Since financial leverage can artificially inflate ROE, we need to look at how much debt Cenovus Energy currently has. Currently the debt-to-equity ratio stands at a low 47.61%, which means its above-average ROE is driven by its ability to grow its profit without a significant debt burden.

Next Steps:
ROE is one of many ratios which meaningfully dissects financial statements, which illustrates the quality of a company. Cenovus Energy’s above-industry ROE is noteworthy, but it was not high enough to cover its own cost of equity. ROE is not likely to be inflated by excessive debt funding, giving shareholders more conviction in the sustainability of industry-beating returns. ROE is a helpful signal, but it is definitely not sufficient on its own to make an investment decision.
For Cenovus Energy, I’ve compiled three pertinent factors you should look at:
Financial Health: Does it have a healthy balance sheet? Take a look at our free balance sheet analysis with six simple checks on key factors like leverage and risk.
Valuation: What is Cenovus Energy worth today? Is the stock undervalued, even when its growth outlook is factored into its intrinsic value? The intrinsic value infographic in our free research report helps visualize whether Cenovus Energy is currently mispriced by the market.
Other High-Growth Alternatives : Are there other high-growth stocks you could be holding instead of Cenovus Energy? Explore our interactive list of stocks with large growth potential to get an idea of what else is out there you may be missing!
To help readers see pass the short term volatility of the financial market, we aim to bring you a long-term focused research analysis purely driven by fundamental data. Note that our analysis does not factor in the latest price sensitive company announcements.
The author is an independent contributor and at the time of publication had no position in the stocks mentioned.
