What is Behind Keyera Corp’s (TSE:KEY) Superior ROE?

With an ROE of 12.50%, Keyera Corp (TSX:KEY) outpaced its own industry which delivered a less exciting 6.62% over the past year. On the surface, this looks fantastic since we know that KEY has made large profits from little equity capital; however, ROE doesn’t tell us if management have borrowed heavily to make this happen. Today, we’ll take a closer look at some factors like financial leverage to see how sustainable KEY’s ROE is. See our latest analysis for Keyera
Peeling the layers of ROE – trisecting a company’s profitability
Firstly, Return on Equity, or ROE, is simply the percentage of last years’ earning against the book value of shareholders’ equity. For example, if the company invests CA$1 in the form of equity, it will generate CA$0.12 in earnings from this. While a higher ROE is preferred in most cases, there are several other factors we should consider before drawing any conclusions.
Return on Equity = Net Profit ÷ Shareholders Equity
Returns are usually compared to costs to measure the efficiency of capital. Keyera’s cost of equity is 11.65%. Since Keyera’s return covers its cost in excess of 0.85%, its use of equity capital is efficient and likely to be sustainable. Simply put, Keyera pays less for its capital than what it generates in return. ROE can be dissected into three distinct ratios: net profit margin, asset turnover, and financial leverage. This is called the Dupont Formula:
Dupont Formula
ROE = profit margin × asset turnover × financial leverage
ROE = (annual net profit ÷ sales) × (sales ÷ assets) × (assets ÷ shareholders’ equity)
ROE = annual net profit ÷ shareholders’ equity

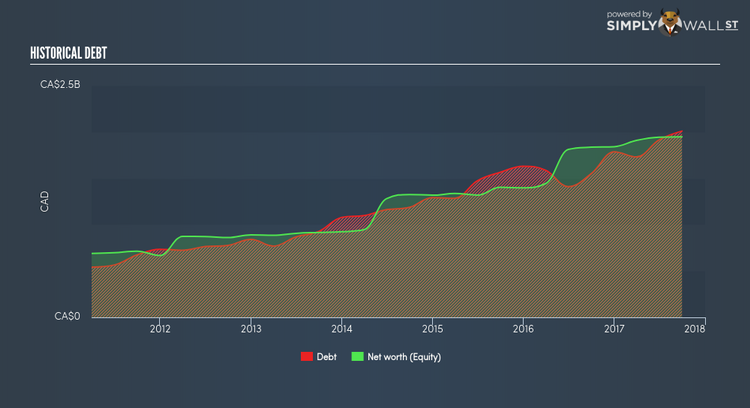
The first component is profit margin, which measures how much of sales is retained after the company pays for all its expenses. Asset turnover reveals how much revenue can be generated from Keyera’s asset base. The most interesting ratio, and reflective of sustainability of its ROE, is financial leverage. Since financial leverage can artificially inflate ROE, we need to look at how much debt Keyera currently has. The debt-to-equity ratio currently stands at a balanced 103.13%, meaning the above-average ROE is due to its capacity to produce profit growth without a huge debt burden.
What this means for you:
Are you a shareholder? KEY’s ROE is impressive relative to the industry average and also covers its cost of equity. Since ROE is not inflated by excessive debt, it might be a good time to add more of KEY to your portfolio if your personal research is confirming what the ROE is telling you. If you’re looking for new ideas for high-returning stocks, you should take a look at our free platform to see the list of stocks with Return on Equity over 20%.
Are you a potential investor? If KEY has been on your watch list for a while, making an investment decision based on ROE alone is unwise. I recommend you do additional fundamental analysis by looking through our most recent infographic report on Keyera to help you make a more informed investment decision.
To help readers see pass the short term volatility of the financial market, we aim to bring you a long-term focused research analysis purely driven by fundamental data. Note that our analysis does not factor in the latest price sensitive company announcements.
The author is an independent contributor and at the time of publication had no position in the stocks mentioned.
