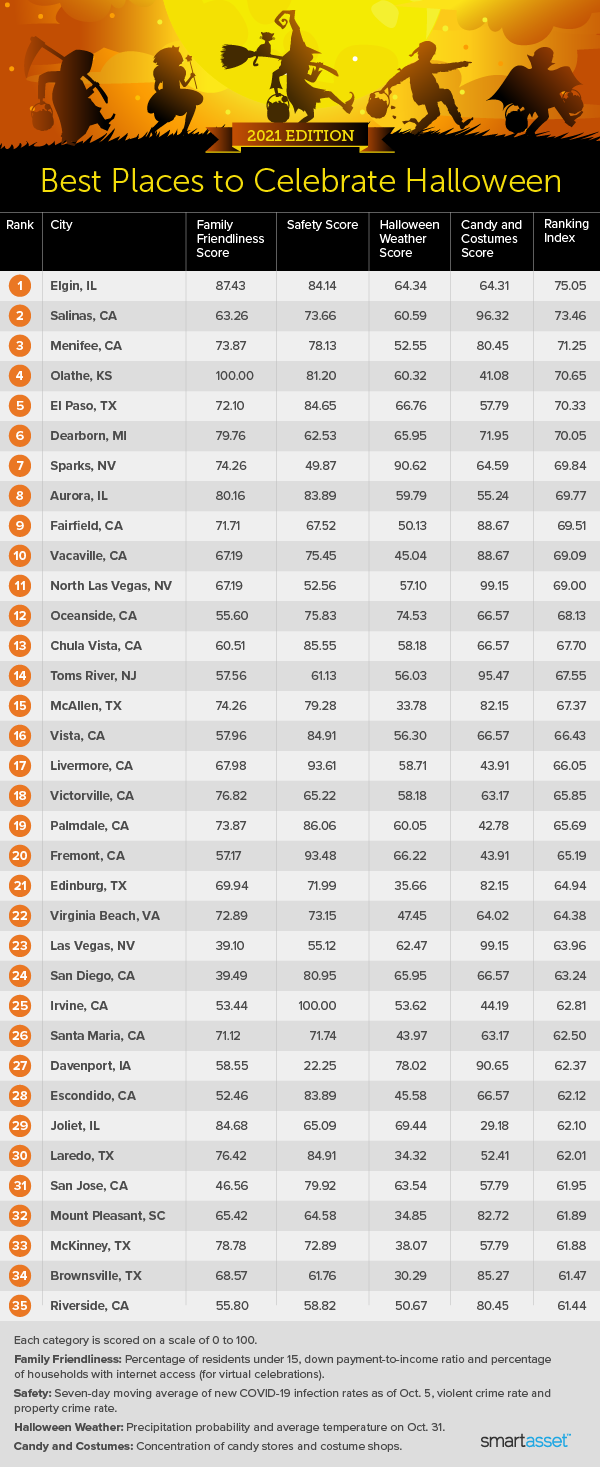
Best Places to Celebrate Halloween in 2021

Listen up, ladies and ghouls – it’s Spooky Season once again. Get out your favorite decorations, figure out your costume ideas and get ready to eat more candy than you should, because Halloween is upon us. While the COVID-19 pandemic may still put a bit of a damper on the holiday once again this year, hopefully many people, especially those with kids, will be able to celebrate. SmartAsset crunched the numbers to identify and rank the best cities in America for Halloween (though unfortunately, we couldn’t confirm how many houses hand out full-size candy bars vs. how many hand out raisins).
To find the best cities to celebrate All Hallows’ Eve, we compared 210 cities across metrics including the percentage of children in the population, housing affordability, internet access, crime rates, COVID infection rates, weather, number of costume shops and number of candy stores. For more details, read the Data and Methodology section below.
This is SmartAsset’s 2021 study on the best places to celebrate Halloween. Read our 2020 study on the best places to trick-or-treat here.
Key Findings
California snags four of the spookiest spots. The Golden State has four of the top 10 cities in this study – Salinas, Menifee, Fairfield and Vacaville. All four rank in the top 50 for our safety index and in the top 20 for our Halloween festiveness index. There are also seven more California locales in the top 20, so if you’re a true Pumpkinhead looking for a place where you can let your inner ghost out, head to the West Coast.
There are costume and candy stores galore in Clark County, Nevada and Kane County, Illinois. Across the counties represented by all 210 cities in this study, there are an average of 27.68 costume shops and 3.99 candy shops for every 10,000 total establishments. The county with the highest concentration of costume shops is Clark County, Nevada – home to both North Las Vegas (No. 11) and Las Vegas (No. 23) – where there are 57.76 for every 10,000 total establishments. The county densest with candy stores is Kane County, Illinois – home to the city of Elgin (No. 1) – with 13.79 for every 10,000 establishments.
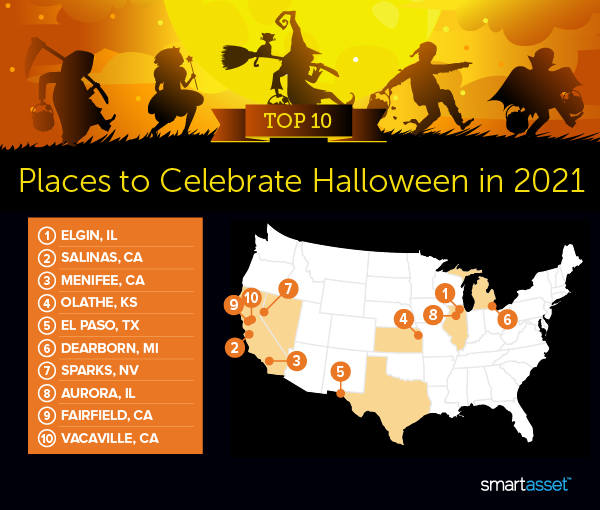
1. Elgin, IL
Elgin, Illinois is the best city in America to celebrate Halloween, riding the third-best ratings in our family friendliness index to the top of the list. People under the age of 14 make up 22.61% of the population, and the down payment-to-income-ratio is 0.70, ranking 26th and 37, respectively. The city is also relatively safe, with the sixth-lowest rate of property crime (1,275 incidents for every 100,000 residents).
2. Salinas, CA
Salinas, California ranks fourth in our study for the Halloween festiveness index. That includes having 41.90 costume shops and 11.33 candy stores for every 10,000 total establishments, ranking 17th and fifth in this study, respectively. Salinas is on the expensive side, though, falling close to the bottom with a down payment-to-income ratio of 1.92.
3. Menifee, CA
Menifee, California has just a 0.6% chance of precipitation on Halloween, making it the city in this study where your trick-or-treating is least likely to get cancelled because of weather. The city ranks 28th out of 210 for relatively high youth population, with 22.41% of residents age 14 or younger.
4. Olathe, KS
Olathe, Kansas is the most family-friendly city in this study. That includes a population where 23.65% of residents are age 14 or younger and the down payment-to-income ratio is 0.72, ranking 15th and 40th in this study, respectively. Internet access is also very common, placing 23rd with 93.35% of households having connection access – helping to make any of your virtual ghoulish gatherings, as well as last-minute costume-related purchases, feel less like a nightmare.
5. El Paso, TX
El Paso, Texas is the 12th-safest city in this study. That is driven by having the 18th-lowest property crime rate (1,511 incidents for every 100,000 residents) and the 29th-fewest daily new COVID cases per 100,000 people (15.06). Olathe ranks fifth for costume shops, with 52.14 for every 10,000 establishments.
6. Dearborn, MI
Dearborn, Michigan ranks 15th for our family friendliness index, specifically ranking fifth-highest for youth population (24.87% of residents age 14 or younger) and 44th-best in home affordability (with a down payment-to-income ratio of 0.72). The city ranks in the top quartile for temperature, with the Halloween average deviating just 3.2 degrees from a perfect 60 degrees.
7. Sparks, NV
The weather is great for Halloween celebrations in Sparks, Nevada, with only a 1.0% chance of precipitation and the average temperature varying just 3.4 degrees from a perfect 60 (ranking ninth and 44th, respectively). It’s also a fairly young city, with 21.93% of the population aged 14 or younger (the 33rd-highest youth population overall).
8. Aurora, IL
Aurora, Illinois is the 13th-most family friendly city on our list and the 14th-safest. It ranks second-lowest for property crime (1,008 incidents per 100,000 residents) and 34th-lowest for violent crime (258 incidents for every 100,000 residents). Aurora’s down payment-to-income ratio is 23rd-best in this study (0.62).
9. Fairfield, CA
Fairfield, California ranks eighth in the Halloween festiveness index of this study. There are 33.10 costume shops and 12.41 candy stores for every 10,000 total establishments, ranking 47th and second, respectively. Fairfield also ranks sixth for internet access, with 95.08% of households able to access the internet.
10. Vacaville, CA
The final city in the top 10 is Vacaville, California, which shares its festiveness metrics with Fairfield, as they are in the same county. Vacaville has 94.12% of households able to connect to the internet, good for 15th out of 210 in the study. It places 39th-lowest for the number of COVID-19 cases, with 16.88 new cases for every 100,000 residents each day.
Data and Methodology
To find the best cities to celebrate Halloween in 2021, we analyzed 210 cities in 10 metrics across four categories:
Family Friendliness Metrics
Percentage of residents 14 years or younger. Data comes from the U.S. Census Bureau’s 2019 1-Year American Community Survey.
Housing costs as a percentage of income. Data comes from the U.S. Census Bureau’s 2019 1-Year American Community Survey.
Percentage of households with internet access. Data comes from the U.S. Census Bureau’s 2019 1-Year American Community Survey.
Safety Metrics
Violent crime rate. This is the number of violent crimes per 100,000 residents. Data comes from the FBI’s 2019 Uniform Crime Reporting database as well as NeighborhoodScout.com.
Property crime rate. This is the number of property crimes per 100,000 residents. Data comes from the FBI’s 2019 Uniform Crime Reporting database as well as NeighborhoodScout.com.
Daily new COVID-19 cases per 100,000 residents. This is the seven-day moving average of newly confirmed COVID-19 cases as of Oct. 5, 2021. Data is measured at the county level and comes from https://github.com/nytimes/covid-19-data.
Halloween Weather Metrics
Precipitation probability. This is the chance it rains 0.5 inches or snows 0.1 inches on Halloween. Data comes from the National Oceanic and Atmospheric Administration (NOAA) and is as of Oct. 5, 2021.
Average temperature. This is the average maximum temperature on Oct. 31, from 1981 to 2010. We compared the average maximum temperature to 60 degrees Fahrenheit, which we think is the perfect temperature for trick-or-treating. Data comes from the National Oceanic and Atmospheric Administration (NOAA).
Candy & Costumes Metrics
Concentration of candy stores. The number of candy stores (including confectionary and nut stores) per 10,000 establishments. Data is measured at the county level and comes from the 2019 County Business Patterns Survey.
Concentration of costume shops. The number of costume shops (including clothing accessory stores, other clothing stores and formal wear and costume rental stores) per 10,000 establishments. Data is measured at the county level and comes from the 2019 County Business Patterns Survey.
First, we ranked each city in each metric, assigning equal weight to every metric except for the two crime metrics, which each received a half-weight. Then we averaged the rankings across the four categories listed above. For each category, the city with the highest average ranking received a score of 100. The city with the lowest average ranking received a score of 0. We created our final ranking by calculating each city’s average score for all three categories.
Some Spooooky Financial Tips
What’s scarier than any ghost or ghoul? The haunting specter of an underfunded retirement. To avoid this horror, consider working with a financial advisor. SmartAsset’s free tool matches you with up to three financial advisors in your area, and you can interview your advisor matches at no cost to decide which one is right for you. If you’re ready to find an advisor who can help you achieve your financial goals, get started now.
You don’t need a magic spell to start sprucing up your budgeting. Setting a budget for you and your family may sound complex and scary, but with SmartAsset’s budget tool you can prove to yourself that the ghost is just a kid in a sheet.
Questions about our study? Contact press@smartasset.com.
Photo credit: ©iStock.com/AlexRaths
The post Best Places to Celebrate Halloween in 2021 appeared first on SmartAsset Blog.
