Is Bhartiya International Limited (NSE:BIL) Better Than Average At Deploying Capital?

Today we are going to look at Bhartiya International Limited (NSE:BIL) to see whether it might be an attractive investment prospect. To be precise, we'll consider its Return On Capital Employed (ROCE), as that will inform our view of the quality of the business.
First of all, we'll work out how to calculate ROCE. Next, we'll compare it to others in its industry. And finally, we'll look at how its current liabilities are impacting its ROCE.
Return On Capital Employed (ROCE): What is it?
ROCE measures the amount of pre-tax profits a company can generate from the capital employed in its business. Generally speaking a higher ROCE is better. Overall, it is a valuable metric that has its flaws. Renowned investment researcher Michael Mauboussin has suggested that a high ROCE can indicate that 'one dollar invested in the company generates value of more than one dollar'.
How Do You Calculate Return On Capital Employed?
The formula for calculating the return on capital employed is:
Return on Capital Employed = Earnings Before Interest and Tax (EBIT) ÷ (Total Assets - Current Liabilities)
Or for Bhartiya International:
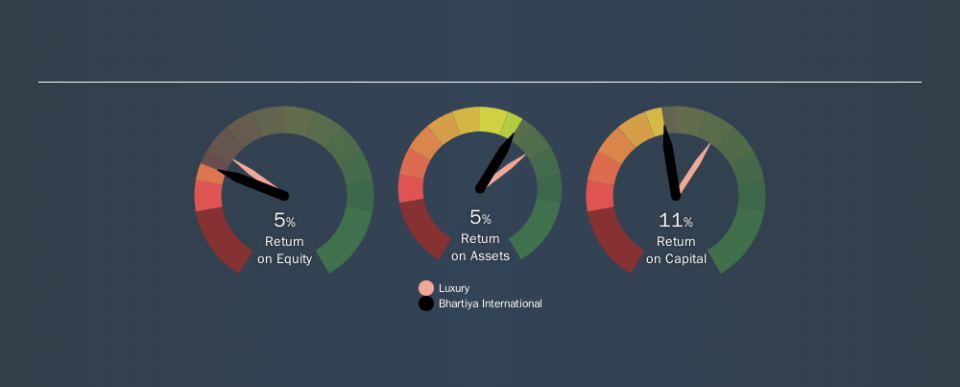
0.11 = ₹510m ÷ (₹9.2b - ₹4.5b) (Based on the trailing twelve months to June 2019.)
So, Bhartiya International has an ROCE of 11%.
Check out our latest analysis for Bhartiya International
Does Bhartiya International Have A Good ROCE?
When making comparisons between similar businesses, investors may find ROCE useful. We can see Bhartiya International's ROCE is around the 12% average reported by the Luxury industry. Setting aside the industry comparison for now, Bhartiya International's ROCE is mediocre in absolute terms, considering the risk of investing in stocks versus the safety of a bank account. Readers may find more attractive investment prospects elsewhere.
We can see that, Bhartiya International currently has an ROCE of 11%, less than the 16% it reported 3 years ago. So investors might consider if it has had issues recently. You can see in the image below how Bhartiya International's ROCE compares to its industry. Click to see more on past growth.
When considering ROCE, bear in mind that it reflects the past and does not necessarily predict the future. ROCE can be deceptive for cyclical businesses, as returns can look incredible in boom times, and terribly low in downturns. This is because ROCE only looks at one year, instead of considering returns across a whole cycle. How cyclical is Bhartiya International? You can see for yourself by looking at this free graph of past earnings, revenue and cash flow.
Bhartiya International's Current Liabilities And Their Impact On Its ROCE
Liabilities, such as supplier bills and bank overdrafts, are referred to as current liabilities if they need to be paid within 12 months. The ROCE equation subtracts current liabilities from capital employed, so a company with a lot of current liabilities appears to have less capital employed, and a higher ROCE than otherwise. To counter this, investors can check if a company has high current liabilities relative to total assets.
Bhartiya International has total assets of ₹9.2b and current liabilities of ₹4.5b. As a result, its current liabilities are equal to approximately 49% of its total assets. Bhartiya International has a medium level of current liabilities, which would boost its ROCE somewhat.
The Bottom Line On Bhartiya International's ROCE
With this level of liabilities and a mediocre ROCE, there are potentially better investments out there. You might be able to find a better investment than Bhartiya International. If you want a selection of possible winners, check out this free list of interesting companies that trade on a P/E below 20 (but have proven they can grow earnings).
I will like Bhartiya International better if I see some big insider buys. While we wait, check out this free list of growing companies with considerable, recent, insider buying.
We aim to bring you long-term focused research analysis driven by fundamental data. Note that our analysis may not factor in the latest price-sensitive company announcements or qualitative material.
If you spot an error that warrants correction, please contact the editor at editorial-team@simplywallst.com. This article by Simply Wall St is general in nature. It does not constitute a recommendation to buy or sell any stock, and does not take account of your objectives, or your financial situation. Simply Wall St has no position in the stocks mentioned. Thank you for reading.
