What Can We Make Of BHP Group’s (ASX:BHP) High Return On Capital?

Want to help shape the future of investing tools? Participate in a short research study and receive a 6-month subscription to the award winning Simply Wall St research tool (valued at $60)!
Today we’ll evaluate BHP Group (ASX:BHP) to determine whether it could have potential as an investment idea. Specifically, we’ll consider its Return On Capital Employed (ROCE), since that will give us an insight into how efficiently the business can generate profits from the capital it requires.
First, we’ll go over how we calculate ROCE. Next, we’ll compare it to others in its industry. Then we’ll determine how its current liabilities are affecting its ROCE.
What is Return On Capital Employed (ROCE)?
ROCE is a measure of a company’s yearly pre-tax profit (its return), relative to the capital employed in the business. In general, businesses with a higher ROCE are usually better quality. Ultimately, it is a useful but imperfect metric. Renowned investment researcher Michael Mauboussin has suggested that a high ROCE can indicate that ‘one dollar invested in the company generates value of more than one dollar’.
So, How Do We Calculate ROCE?
Analysts use this formula to calculate return on capital employed:
Return on Capital Employed = Earnings Before Interest and Tax (EBIT) ÷ (Total Assets – Current Liabilities)
Or for BHP Group:
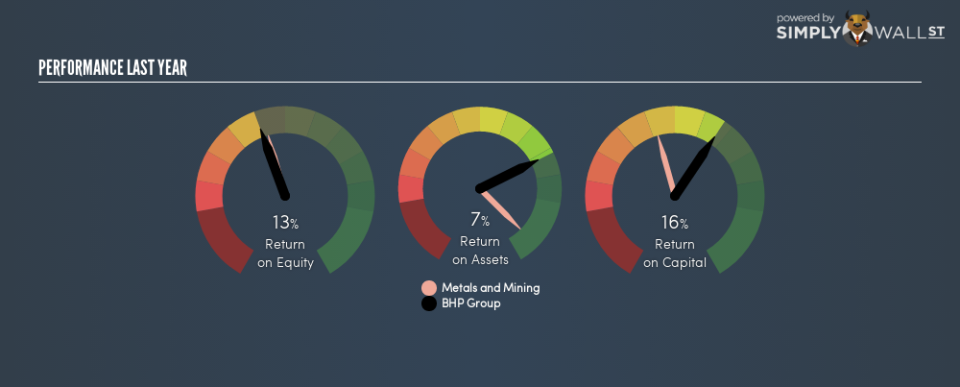
0.16 = US$16b ÷ (US$112b – US$14b) (Based on the trailing twelve months to June 2018.)
So, BHP Group has an ROCE of 16%.
Check out our latest analysis for BHP Group
Is BHP Group’s ROCE Good?
ROCE is commonly used for comparing the performance of similar businesses. BHP Group’s ROCE appears to be substantially greater than the 12% average in the Metals and Mining industry. We consider this a positive sign, because it suggests it uses capital more efficiently than similar companies. Independently of how BHP Group compares to its industry, its ROCE in absolute terms appears decent, and the company may be worthy of closer investigation.
Our data shows that BHP Group currently has an ROCE of 16%, compared to its ROCE of 10% 3 years ago. This makes us think the business might be improving.
When considering ROCE, bear in mind that it reflects the past and does not necessarily predict the future. Companies in cyclical industries can be difficult to understand using ROCE, as returns typically look high during boom times, and low during busts. This is because ROCE only looks at one year, instead of considering returns across a whole cycle. Given the industry it operates in, BHP Group could be considered cyclical. Since the future is so important for investors, you should check out our free report on analyst forecasts for BHP Group.
BHP Group’s Current Liabilities And Their Impact On Its ROCE
Current liabilities are short term bills and invoices that need to be paid in 12 months or less. Due to the way ROCE is calculated, a high level of current liabilities makes a company look as though it has less capital employed, and thus can (sometimes unfairly) boost the ROCE. To counteract this, we check if a company has high current liabilities, relative to its total assets.
BHP Group has total assets of US$112b and current liabilities of US$14b. As a result, its current liabilities are equal to approximately 12% of its total assets. A fairly low level of current liabilities is not influencing the ROCE too much.
The Bottom Line On BHP Group’s ROCE
Overall, BHP Group has a decent ROCE and could be worthy of further research. Of course, you might find a fantastic investment by looking at a few good candidates. So take a peek at this free list of companies with modest (or no) debt, trading on a P/E below 20.
For those who like to find winning investments this free list of growing companies with recent insider purchasing, could be just the ticket.
To help readers see past the short term volatility of the financial market, we aim to bring you a long-term focused research analysis purely driven by fundamental data. Note that our analysis does not factor in the latest price-sensitive company announcements.
The author is an independent contributor and at the time of publication had no position in the stocks mentioned. For errors that warrant correction please contact the editor at editorial-team@simplywallst.com.
