Has bioMérieux SA (EPA:BIM) Improved Earnings Growth In Recent Times?

Investors with a long-term horizong may find it valuable to assess bioMérieux SA’s (EPA:BIM) earnings trend over time and against its industry benchmark as opposed to simply looking at a sincle earnings announcement at one point in time. Below is my commentary, albiet very simple and high-level, on how bioMérieux is currently performing.
See our latest analysis for bioMérieux
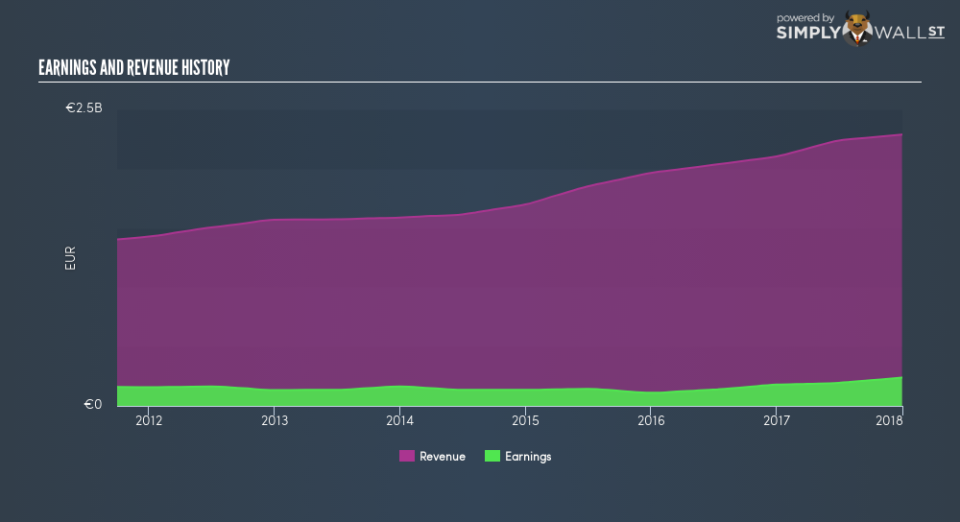
Did BIM beat its long-term earnings growth trend and its industry?
BIM’s trailing twelve-month earnings (from 31 December 2017) of €238.1m has jumped 32.9% compared to the previous year. Furthermore, this one-year growth rate has exceeded its 5-year annual growth average of 4.1%, indicating the rate at which BIM is growing has accelerated. How has it been able to do this? Well, let’s take a look at if it is solely because of industry tailwinds, or if bioMérieux has seen some company-specific growth.
The hike in earnings seems to be supported by a solid top-line increase overtaking its growth rate of expenses. Though this resulted in a margin contraction, it has made bioMérieux more profitable. Viewing growth from a sector-level, the FR medical equipment industry has been growing, albeit, at a unexciting single-digit rate of 9.5% over the previous year, and a substantial 17.1% over the past five. Since the Medical Equipment sector in FR is relatively small, I’ve included similar companies in the wider region in order to get a better idea of the growth, which is a median of profitable companies of companies such as Essilor International Société Anonyme, Guerbet and Guerbet. This means that whatever uplift the industry is benefiting from, bioMérieux is able to leverage this to its advantage.
In terms of returns from investment, bioMérieux has fallen short of achieving a 20% return on equity (ROE), recording 13.7% instead. However, its return on assets (ROA) of 8.5% exceeds the FR Medical Equipment industry of 5.5%, indicating bioMérieux has used its assets more efficiently. And finally, its return on capital (ROC), which also accounts for bioMérieux’s debt level, has increased over the past 3 years from 10.8% to 13.3%.
What does this mean?
While past data is useful, it doesn’t tell the whole story. While bioMérieux has a good historical track record with positive growth and profitability, there’s no certainty that this will extrapolate into the future. You should continue to research bioMérieux to get a better picture of the stock by looking at:
Future Outlook: What are well-informed industry analysts predicting for BIM’s future growth? Take a look at our free research report of analyst consensus for BIM’s outlook.
Financial Health: Are BIM’s operations financially sustainable? Balance sheets can be hard to analyze, which is why we’ve done it for you. Check out our financial health checks here.
Other High-Performing Stocks: Are there other stocks that provide better prospects with proven track records? Explore our free list of these great stocks here.
NB: Figures in this article are calculated using data from the trailing twelve months from 31 December 2017. This may not be consistent with full year annual report figures.
To help readers see past the short term volatility of the financial market, we aim to bring you a long-term focused research analysis purely driven by fundamental data. Note that our analysis does not factor in the latest price-sensitive company announcements.
The author is an independent contributor and at the time of publication had no position in the stocks mentioned. For errors that warrant correction please contact the editor at editorial-team@simplywallst.com.
