Bitcoin Confounds Us Again
Bitcoin is certainly becoming a wild card. “Normal,” rules do not seem to apply on many occasions – yet, on others, Bitcoin follows technical patterns in an almost textbook way.
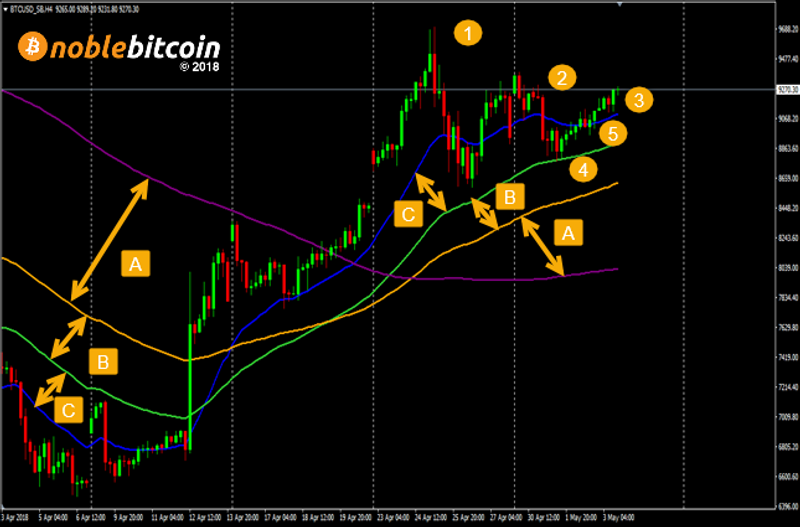
This is the 4-hourly chart of Bitcoin for the last month. This means each of these candles represents a period of four hours before the next one. It shows a much clearer picture of what has occurred with Bitcoin through the latter part of April – and why we are confident Bitcoin has turned a corner.
If you follow our posts you will be familiar with us using the 21-day EMA (exponential moving average) the 55-day EMA, the 100-day EMA, and the 200-day SMA (simple moving average) as support and resistance levels. These are shown on our charts as the blue line, the green line, the orange line, and the purple line, respectively.
From a technical point of view, a downtrend is signified by the arrangement of the moving averages in relation to each other.
On the chart, the 200-day SMA is above the 100-day EMA. This is shown by the square A) on the left of the chart. Look at square A) on the right side of the chart, though, and you will see this situation is reversed – with the 100-day EMA above the 200-day EMA.
If you look at squares B), and C) – and compare their positions on the left side of the chart, with those on the right side of the chart – you will see this reversal repeat itself for each of the moving average lines. The right hand side is the arrangement we would expect in an uptrend.
You will notice, that after flattening off at the beginning of April, the price climbed sharply after the 21-day EMA crossed the 55-day EMA. This was triggered by the infamous 10% rise, by Bitcoin, on 12th April.
Following on, there is a large movement in price when the 21-day EMA crosses the 100-day EMA on 16th of April – and another when it crosses the 200-day EMA, just four days later on 20th April.
These moving average indicators are powerful tools – and they have the ability to predict “normal” movements in the market. This applies to any market – not just Bitcoin, of course.
The 21-day EMA Is particularly predictive. A glance at the chart will show the price moves above and below this average more often than any of the others. When the price is consistently above the 21-day EMA, and the 21-day EMA, in turn, is above the 55-day EMA, the price will normally be in an uptrend. This is useful to us because if the price rises considerably above the 21-day EMA, but falls back to it, it presents us with a buying opportunity before the price regains its upward trajectory again.
This is the theory anyway.
Backed by the 21-day EMA theory, we think that if Bitcoin can keep upward momentum – and stay closed above the previous recent highs of $9,420 of 30th April, then it will rally higher.
The next test for it will then be the $11,435-$12,770 zone. It must get through this to continue higher. If it rebounds from this retest and falls back to the previous low of $5,943 or below – it could be in serious trouble.
We are not expecting this outcome – but, as the old saying goes – expect the best outcome, but prepare for the worst …
This article was originally posted on FX Empire
