
Blue Chip on the Verge of a Breakout to New All-Time Highs
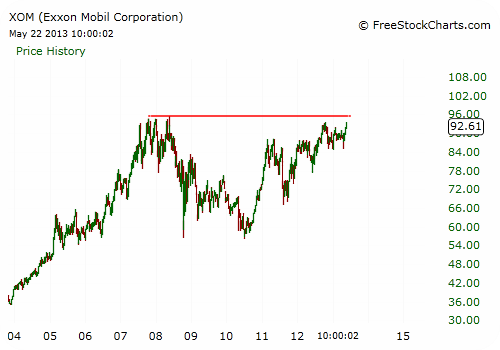
Oil and natural gas blue chip Exxon Mobil (XOM) is currently trading roughly 3% below its all-time high, which dates back to May 2008. The stock has endured a wild ride since that high, but the stair-step approach it has taken in its most recent rise puts the stock in a good position to take out its all-time highs sooner rather than later.
Given the critical level the stock finds itself at, I wouldn't expect a clear breakout to all-time highs, but rather some backing and filling with the occasional breakout fake out, and that's exactly where I am seeing a trade setting up.
Along with most stocks, the financial crisis weighed on XOM as it slipped roughly 40% from its May 2008 highs to the October 2008 lows.
After a sharp rally and subsequent slow ride lower again, the stock retested its October 2008 lows in the summer of 2010, which in hindsight, established the $56 area as a meaningful double-bottom. So, after a few years of sloppy trading action, the stock started to trade in technical perfection once the double-bottom was in place.
Since July 2012, followers of Fibonacci retracements and extension have enjoyed a Goldilocks environment where every major retracement of between 50% and 61.8% eventually led to higher highs.
On the next chart, note that after a sharp rally off the July 2012 double-bottom, XOM retraced exactly 61.8% by August 2011. From there, the next rally leg topped in early 2012, and by the time the correction was over in June 2012, the stock had retraced 50% of the rally. The pattern then continued, and the next rally topped in October 2012, which led to another correction of 50% before finding a better bottom.

The November 2012 pullback down to the $85 area has since been retested two more times, allowing XOM to form a solid base from which it ultimately pushed higher again in April and thus far in May. In other words, the stock continues to behave well technically by forming consolidation areas that allow it to work higher.
With its latest three-day rally, XOM has now retested its October 2012 highs near $93.50, which could act as some near-term resistance. The stock is only a little more than 3% away from its all-time closing highs near $95 and roughly 4% away from its all-time intraday high near $96. Given its orderly move off the July 2010 double-bottom and energetic move higher off its more recent support at $85, XOM looks to have enough momentum to hit a new all-time high.
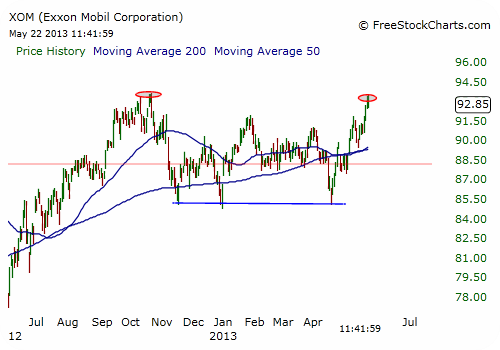
The stock's breakout last week past minor resistance at $92 and the October 2012 highs near $93.60 give traders a defined buying range. A target around $98 seems reasonable, but given the critical juncture at which XOM currently trades, this may require a somewhat longer time frame than I typically use.
Recommended Trade Setup:
-- Buy XOM between $92 and $93.60
-- Set stop-loss at $90.50
-- Set price target at $98 for a potential 5%-7% gain in eight weeks
Related Articles
Income Traders Could Pick Up Shares of This Cultural Icon at a 19% Discount
Indicator Signals It's Time to Invest in Precious Metals... But Not the One You May Think
Looming Cash Crunch Could Cause This Retail Stock to Plummet 30%
