Is boohoo group (LON:BOO) A Risky Investment?

Warren Buffett famously said, 'Volatility is far from synonymous with risk.' It's only natural to consider a company's balance sheet when you examine how risky it is, since debt is often involved when a business collapses. We can see that boohoo group plc (LON:BOO) does use debt in its business. But the more important question is: how much risk is that debt creating?
When Is Debt A Problem?
Generally speaking, debt only becomes a real problem when a company can't easily pay it off, either by raising capital or with its own cash flow. Ultimately, if the company can't fulfill its legal obligations to repay debt, shareholders could walk away with nothing. However, a more frequent (but still costly) occurrence is where a company must issue shares at bargain-basement prices, permanently diluting shareholders, just to shore up its balance sheet. Of course, the upside of debt is that it often represents cheap capital, especially when it replaces dilution in a company with the ability to reinvest at high rates of return. The first step when considering a company's debt levels is to consider its cash and debt together.
Check out our latest analysis for boohoo group
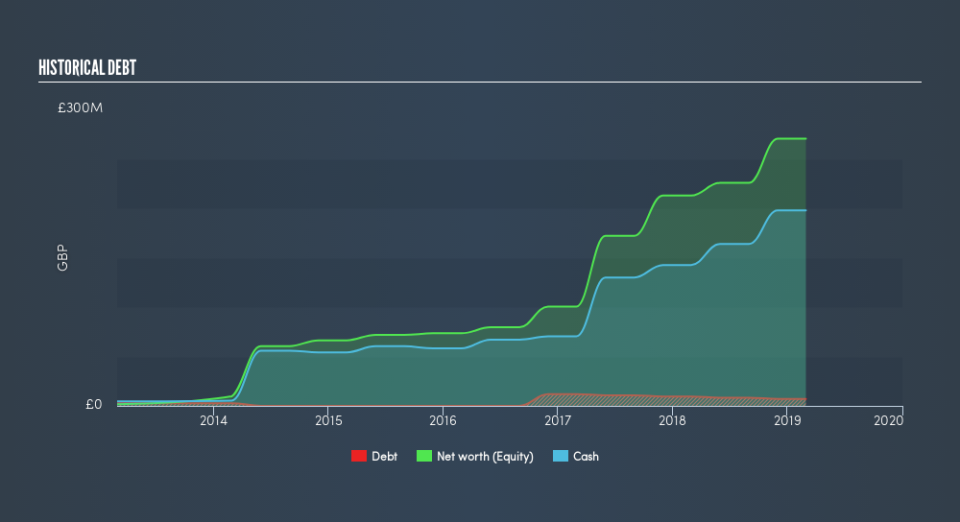
What Is boohoo group's Debt?
As you can see below, boohoo group had UK£7.15m of debt at February 2019, down from UK£9.53m a year prior. But it also has UK£197.9m in cash to offset that, meaning it has UK£190.7m net cash.
How Strong Is boohoo group's Balance Sheet?
The latest balance sheet data shows that boohoo group had liabilities of UK£162.1m due within a year, and liabilities of UK£7.28m falling due after that. Offsetting these obligations, it had cash of UK£197.9m as well as receivables valued at UK£20.6m due within 12 months. So it actually has UK£49.1m more liquid assets than total liabilities.
This state of affairs indicates that boohoo group's balance sheet looks quite solid, as its total liabilities are just about equal to its liquid assets. So it's very unlikely that the UK£2.71b company is short on cash, but still worth keeping an eye on the balance sheet. Simply put, the fact that boohoo group has more cash than debt is arguably a good indication that it can manage its debt safely.
In addition to that, we're happy to report that boohoo group has boosted its EBIT by 53%, thus reducing the spectre of future debt repayments. The balance sheet is clearly the area to focus on when you are analysing debt. But it is future earnings, more than anything, that will determine boohoo group's ability to maintain a healthy balance sheet going forward. So if you're focused on the future you can check out this free report showing analyst profit forecasts.
But our final consideration is also important, because a company cannot pay debt with paper profits; it needs cold hard cash. boohoo group may have net cash on the balance sheet, but it is still interesting to look at how well the business converts its earnings before interest and tax (EBIT) to free cash flow, because that will influence both its need for, and its capacity to manage debt. During the last three years, boohoo group produced sturdy free cash flow equating to 56% of its EBIT, about what we'd expect. This free cash flow puts the company in a good position to pay down debt, when appropriate.
Summing up
While we empathize with investors who find debt concerning, you should keep in mind that boohoo group has net cash of UK£191m, as well as more liquid assets than liabilities. And we liked the look of last year's 53% year-on-year EBIT growth. So we don't think boohoo group's use of debt is risky. We'd be very excited to see if boohoo group insiders have been snapping up shares. If you are too, then click on this link right now to take a (free) peek at our list of reported insider transactions.
Of course, if you're the type of investor who prefers buying stocks without the burden of debt, then don't hesitate to discover our exclusive list of net cash growth stocks, today.
We aim to bring you long-term focused research analysis driven by fundamental data. Note that our analysis may not factor in the latest price-sensitive company announcements or qualitative material.
If you spot an error that warrants correction, please contact the editor at editorial-team@simplywallst.com. This article by Simply Wall St is general in nature. It does not constitute a recommendation to buy or sell any stock, and does not take account of your objectives, or your financial situation. Simply Wall St has no position in the stocks mentioned. Thank you for reading.
