Brent Crude Oil Price Futures (BZ) Technical Analysis – In Position to Challenge Major Retracement Zone at $67.90 to $71.77
International-benchmark Brent crude oil futures closed sharply higher on Friday as investors shrugged off concerns over a recession and lower demand and shifted their focus back to the highly successful OPEC-led production cuts that have worked to tightened the global supply. Additional support was provided by the U.S. sanctions against Iran and Venezuela that also are helping to trim the excess supply.
On Friday, June Brent crude oil futures settled at $67.58, up $0.48 or +0.71%.
Daily Swing Chart Technical Analysis
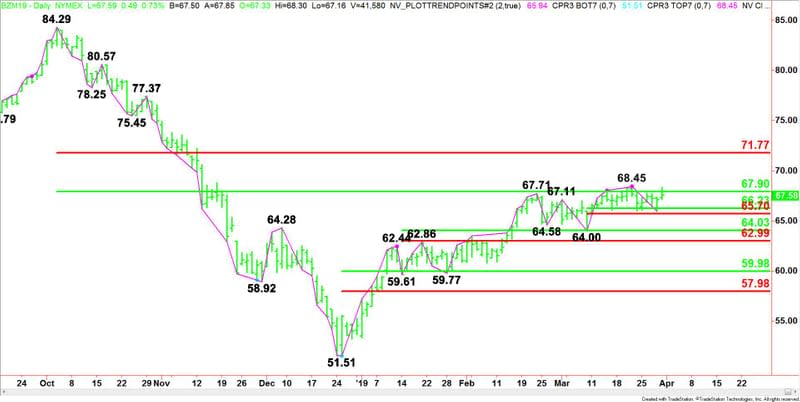
The main trend is up according to the daily swing chart. A trade through $68.45 will signal a resumption of the uptrend. The main trend will change to down on a move through $64.00.
The minor trend is also up. A trade through $68.45 will reaffirm the uptrend, while a move through $65.94 will change the minor trend to down. This will also shift momentum to the downside.
The main range is $84.29 to $51.51. Its retracement zone at $67.90 to $71.77 is the primary upside target. It has also been providing resistance since early February. This zone is controlling the longer-term direction of the market.
The short-term range is $64.00 to $68.45. Its retracement zone at $66.23 to $65.70 provided support last week when buyers came in at $65.94.
The first intermediate-term retracement zone at $64.03 to $62.99 is support. The second intermediate-term retracement zone at $59.98 to $57.98 is additional support.

Daily Swing Chart Technical Forecast
Based on Friday’s price action, the direction of the June Brent crude oil futures contract on Monday is likely to be determined by trader reaction to the main 50% level at $67.90.
Bullish Scenario
A sustained move over $67.90 will indicate the presence of buyers. If this move creates enough upside momentum then look for a rally into the main top at $68.45. This price is a potential trigger point for an acceleration to the upside with the next target the Fibonacci level at $71.77.
Bearish Scenario
A sustained move under $67.90 will signal the presence of sellers. This could lead to a retest of a cluster of levels at $66.23, $65.94 and $65.70.
Look out to the downside if $65.70 fails as support. We could see an acceleration into $64.03, $64.00 and $62.99.
This article was originally posted on FX Empire
