Brent Crude Oil Price Update – Triangle Chart Pattern Indicates Potential Breakout
International-benchmark Brent crude oil is trading slightly better early Tuesday after posting a solid gain the previous session. After posting a mostly sideways trade for about a week due to a tug of war over the fundamentals, traders found a new story to latch onto, sending prices higher. According to reports, the prospect of an expected interest rate cut by the U.S. Federal Reserve on Wednesday, outweighed worries over U.S.-China trade talks and concerns over slower global economic growth.
At 01:13 GMT, October Brent crude oil is trading $63.90, up $0.28 or +0.44%.
Daily Technical Analysis
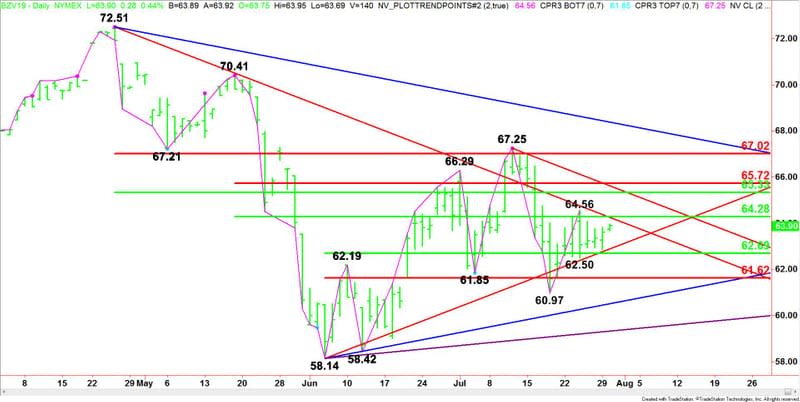
The main trend is down according to the daily swing chart. However, momentum is trending higher. The main trend will change to up on a trade through $67.25. A trade through $60.97 will signal a resumption of the downtrend.
The minor trend is up. This confirms the shift in momentum to the upside. A trade through the minor top at $64.56 will indicate the counter-trend buying is getting stronger. The minor trend changes to down on a trade through $62.50.
The short-term range is $58.14 to $67.25. Its retracement zone at $62.69 to $61.62 is support.
The intermediate range is $70.41 to $58.14. Its retracement zone at $64.28 to $65.72 is potential resistance.
The main range is $72.51 to $58.14. Its retracement zone at $65.33 to $67.02 is another potential resistance zone.
Combining the intermediate and main range retracement zones creates a strong target zone at $65.33 to $65.72.
Daily Technical Forecast
Based on Monday’s close at $63.62, the next move in the market will be momentum driven.
Bullish Scenario
If the upside momentum continues then look for a rally into a resistance cluster at $64.26 to $64.28. Taking out this zone could drive the market into $64.56. This is a potential trigger point for an acceleration into $65.33 to $65.72.
Bearish Scenario
If downside momentum takes over then look for a potential break into the uptrending Gann angle at $62.89. If this fails then look for an extension of the selling into $62.69.
Overview
The market is trading inside a triangle chart pattern. The top end of the triangle is $64.26. The bottom end of the triangle is $62.89. This chart pattern tends to lead to a volatile breakout move. The Apex of the triangle is $63.58 on August 6 to August 7.
This article was originally posted on FX Empire
More From FXEMPIRE:
Natural Gas Price Prediction – Prices Tumble on Cooler Weather Forecast
European Equities: Trade, Corporate Earnings and Stats in Focus
Gold Price Prediction – Prices Consolidate Ahead of BOJ Meeting
Asian Shares Higher Ahead of BOJ Decisions; Aussie Index Hits Record High
Natural Gas Price Forecast – Natural gas markets continue to look soft
US Stock Market Overview – Stock Trade Mixed Ahead Central Bank Decisions
