Briscoe Group Limited (NZSE:BGP) Stock Has Shown Weakness Lately But Financials Look Strong: Should Prospective Shareholders Make The Leap?
It is hard to get excited after looking at Briscoe Group's (NZSE:BGP) recent performance, when its stock has declined 8.5% over the past three months. However, stock prices are usually driven by a company’s financial performance over the long term, which in this case looks quite promising. Particularly, we will be paying attention to Briscoe Group's ROE today.
Return on Equity or ROE is a test of how effectively a company is growing its value and managing investors’ money. Put another way, it reveals the company's success at turning shareholder investments into profits.
Check out our latest analysis for Briscoe Group
How To Calculate Return On Equity?
ROE can be calculated by using the formula:
Return on Equity = Net Profit (from continuing operations) ÷ Shareholders' Equity
So, based on the above formula, the ROE for Briscoe Group is:
29% = NZ$88m ÷ NZ$299m (Based on the trailing twelve months to January 2022).
The 'return' is the amount earned after tax over the last twelve months. One way to conceptualize this is that for each NZ$1 of shareholders' capital it has, the company made NZ$0.29 in profit.
What Is The Relationship Between ROE And Earnings Growth?
We have already established that ROE serves as an efficient profit-generating gauge for a company's future earnings. Based on how much of its profits the company chooses to reinvest or "retain", we are then able to evaluate a company's future ability to generate profits. Assuming all else is equal, companies that have both a higher return on equity and higher profit retention are usually the ones that have a higher growth rate when compared to companies that don't have the same features.
A Side By Side comparison of Briscoe Group's Earnings Growth And 29% ROE
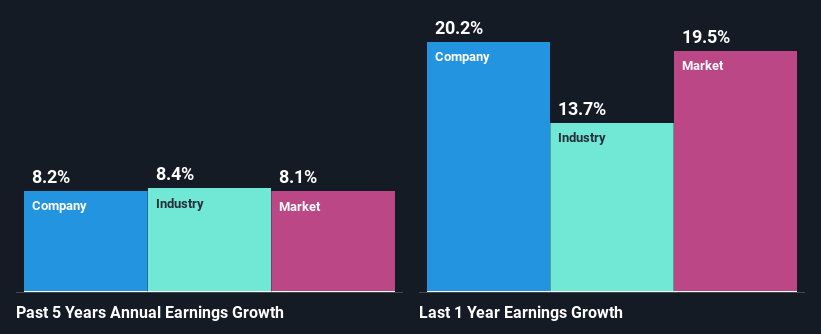
Firstly, we acknowledge that Briscoe Group has a significantly high ROE. Second, a comparison with the average ROE reported by the industry of 12% also doesn't go unnoticed by us. This probably laid the groundwork for Briscoe Group's moderate 8.2% net income growth seen over the past five years.
As a next step, we compared Briscoe Group's net income growth with the industry and found that the company has a similar growth figure when compared with the industry average growth rate of 8.4% in the same period.
The basis for attaching value to a company is, to a great extent, tied to its earnings growth. What investors need to determine next is if the expected earnings growth, or the lack of it, is already built into the share price. Doing so will help them establish if the stock's future looks promising or ominous. One good indicator of expected earnings growth is the P/E ratio which determines the price the market is willing to pay for a stock based on its earnings prospects. So, you may want to check if Briscoe Group is trading on a high P/E or a low P/E, relative to its industry.
Is Briscoe Group Efficiently Re-investing Its Profits?
Briscoe Group has a significant three-year median payout ratio of 62%, meaning that it is left with only 38% to reinvest into its business. This implies that the company has been able to achieve decent earnings growth despite returning most of its profits to shareholders.
Besides, Briscoe Group has been paying dividends for at least ten years or more. This shows that the company is committed to sharing profits with its shareholders. Based on the latest analysts' estimates, we found that the company's future payout ratio over the next three years is expected to hold steady at 70%. As a result, Briscoe Group's ROE is not expected to change by much either, which we inferred from the analyst estimate of 28% for future ROE.
Conclusion
On the whole, we feel that Briscoe Group's performance has been quite good. We are particularly impressed by the considerable earnings growth posted by the company, which was likely backed by its high ROE. While the company is paying out most of its earnings as dividends, it has been able to grow its earnings in spite of it, so that's probably a good sign. Until now, we have only just grazed the surface of the company's past performance by looking at the company's fundamentals. To gain further insights into Briscoe Group's past profit growth, check out this visualization of past earnings, revenue and cash flows.
Have feedback on this article? Concerned about the content? Get in touch with us directly. Alternatively, email editorial-team (at) simplywallst.com.
This article by Simply Wall St is general in nature. We provide commentary based on historical data and analyst forecasts only using an unbiased methodology and our articles are not intended to be financial advice. It does not constitute a recommendation to buy or sell any stock, and does not take account of your objectives, or your financial situation. We aim to bring you long-term focused analysis driven by fundamental data. Note that our analysis may not factor in the latest price-sensitive company announcements or qualitative material. Simply Wall St has no position in any stocks mentioned.
