Broadridge (BR) Q3 Earnings & Revenues Top, EPS View Up

Broadridge Financial Solutions Inc. BR reported strong third-quarter fiscal 2018 results with earnings and revenues surpassing the Zacks Consensus Estimate.
Adjusted earnings of $1.00 per share beat the consensus mark by 21 cents and increased 45% year over year. The bottom line benefited from lower tax rates (as a result of the Tax Cuts and Jobs Act) and improvement in adjusted operating income.
As a result of the Tax Act, the effective tax rate for the reported quarter reduced to 12.9% from 28.6% in the prior-year period. The company also witnessed $15.6 million of tax benefit from stock-based compensation. This was, however, partially offset by $16.1 million of net tax charges associated with the Tax Act.
Total revenues of $1.07 billion beat the Zacks Consensus Estimate of $1.03 billion. The figure was up 6.2% year over year. The top line benefited from robust event-driven fee revenues, higher recurring fee revenues and distribution revenues.
Recurring fee revenues increased 8% to $639 million due to higher organic growth, which was backed by net new business, internal growth and acquisition-related synergies. Event-driven fee revenues increased 9% to $67 million due to higher proxy contests. Distribution revenues increased 2% to $385 million.
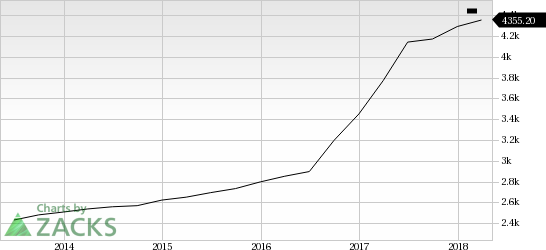
Broadridge Financial Solutions, Inc. Revenue (TTM)
Broadridge Financial Solutions, Inc. Revenue (TTM) | Broadridge Financial Solutions, Inc. Quote
Broadridge looks strong on the back of its business model, driven by higher recurring fee revenues. The company’s focus on enhancing its internal growth with strategic buyouts has always been appreciable. To this end, in the reported quarter, the company completed the acquisition of ActivePath, at an aggregate price of $25 million. The buyout should help Broadridge enhance consumer experience by transforming and improving its digital platform. The company has deployed almost $103 million for acquisitions year-to-date.
Additionally, the company ended the quarter with a healthy balance sheet and strong cash flow, which helped it undertake several shareholder-friendly moves like share buybacks and dividend payments. Such activities not only instill investors’ confidence but also positively impact the bottom line.
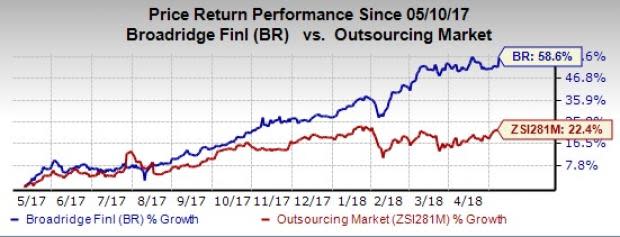
We observe that shares of Broadridge have gained 58.6% in the past year, outperforming the industry’s gain of 22.4%.
Let’s check out the numbers.
Revenues by Segment
Investor Communication Solutions segment (79.79% of total revenues) revenues increased 4.2% from the year-ago quarter to $855.3 million. Segment revenues were driven by higher recurring fee revenues ($403 million) from internal growth, net new business and acquisitions, elevated event-driven fee revenues ($67 million) and distribution revenues ($385 million).
Global Technology and Operations segment (21.94%) revenues came in at $235.2 million, up 12.8% from the year-ago quarter. Segment revenues were driven by internal growth from higher trade and non-trade activity levels, higher net new business from closed sales and buyouts.
Operating Results
Operating income increased 19% year over year to $130 million. Adjusted operating income came in at $152 million, up 13% from the year-ago quarter.
Operating income margin rose to 12.1% from 10.9% in the year-ago quarter. Adjusted operating income margin rose to 14.1% from 13.2% in the year-ago quarter. The margin expansion was driven by higher recurring fee revenues.
Selling, general and administrative expenses increased 10.6% to $138.8 million. Total operating expenses increased 4.7% to $941.9 million.
Balance Sheet and Cash Flow
Broadridge exited third-quarter fiscal 2018 with cash and cash equivalents of $352.1 million, up from $366.5 million at the end of December 2017. As of Mar 31, 2018, long-term debt was $1,203.1 million, up from $1,222.7 million at the end of December 2017.
The company generated $274.8 million of cash from operating activities in the reported quarter compared with $162.1 million in the year-ago quarter. Free cash flow was $204.2 million compared with $92.6 million in the year-ago quarter.
During the reported quarter, the company returned $123 million to its shareholders in the form of dividends compared with $80.4 million in second-quarterfiscal 2018.
Fiscal 2018 Guidance
Broadridge raised its fiscal 2018 guidance for adjusted EPS growth to 31-35% from 27-31%, while reaffirming its outlook for revenue growth and margin expansion.
Total revenues are expected to grow in the rate of 2-4%. Recurring revenue growth is expected in the range of 4-6%. Adjusted operating income margin is still estimated to be approximately 16%. It also reiterated free cash flow expectations in the range of $500-$550 million.
Zacks Rank & Upcoming Releases
Broadridge currently has a Zacks Rank #4 (Sell).
You can see the complete list of today’s Zacks #1 Rank (Strong Buy) stocks here.
Investors interested in the broader Business Services sector are keenly awaiting earnings reports from key players like ABM Industries Incorporated ABM, Accenture plc ACN and FactSet Research Systems Inc. FDC. While Accenture and FactSet Research Systems are expected to report third-quarter fiscal 2018 numbers on Jun 28 and Jun 26, respectively, ABM Industries is expected to release second-quarter fiscal 2018 results on Jun 6.
The Hottest Tech Mega-Trend of All
Last year, it generated $8 billion in global revenues. By 2020, it's predicted to blast through the roof to $47 billion. Famed investor Mark Cuban says it will produce "the world's first trillionaires," but that should still leave plenty of money for regular investors who make the right trades early.
See Zacks' 3 Best Stocks to Play This Trend >>
Want the latest recommendations from Zacks Investment Research? Today, you can download 7 Best Stocks for the Next 30 Days. Click to get this free report
First Data Corporation (FDC) : Free Stock Analysis Report
ABM Industries Incorporated (ABM) : Free Stock Analysis Report
Accenture PLC (ACN) : Free Stock Analysis Report
Broadridge Financial Solutions, Inc. (BR) : Free Stock Analysis Report
To read this article on Zacks.com click here.
Zacks Investment Research
